Unlock a world of possibilities! Login now and discover the exclusive benefits awaiting you.
- Qlik Community
- :
- Discover
- :
- About
- :
- Water Cooler
- :
- need to display one measure with respect to anothe...
Options
- Subscribe to RSS Feed
- Mark Topic as New
- Mark Topic as Read
- Float this Topic for Current User
- Bookmark
- Subscribe
- Mute
- Printer Friendly Page
Turn on suggestions
Auto-suggest helps you quickly narrow down your search results by suggesting possible matches as you type.
Showing results for
Not applicable
2012-05-15
04:38 AM
- Mark as New
- Bookmark
- Subscribe
- Mute
- Subscribe to RSS Feed
- Permalink
- Report Inappropriate Content
need to display one measure with respect to another measure
Hi,
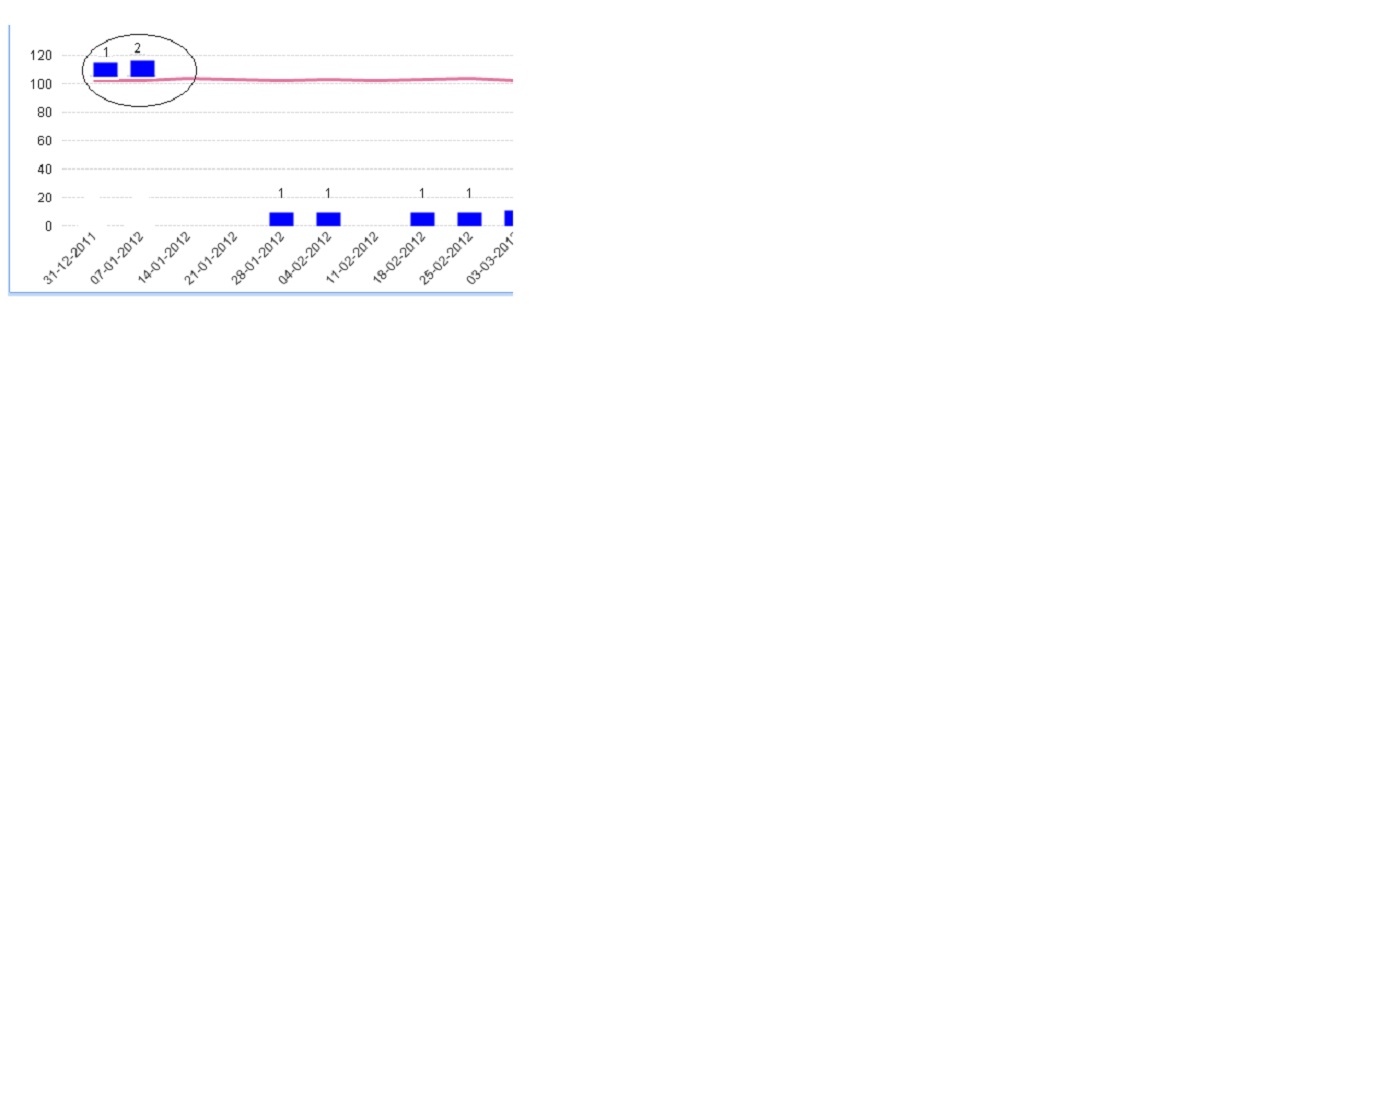
I have a requirement to display 2 measures on a single chart. One of them is shown by symbols and the other by line. I need to display the symbols with respect to the line chart. For example: If the line chart value is 100 for a given date and the symbol value is 1, the data point for symbol should be displayed as 1 unit above the line chart. (See the figure below). Please suggest any settings to achieve this.
Thanks...
206 Views
0 Replies
Community Browser