Unlock a world of possibilities! Login now and discover the exclusive benefits awaiting you.
- Qlik Community
- :
- Forums
- :
- Groups
- :
- Industry and Topics
- :
- Deployment Framework
- :
- Re: Re: Generate a report from two other reports
- Subscribe to RSS Feed
- Mark Topic as New
- Mark Topic as Read
- Float this Topic for Current User
- Bookmark
- Subscribe
- Mute
- Printer Friendly Page
- Feature this Topic
- Mark as New
- Bookmark
- Subscribe
- Mute
- Subscribe to RSS Feed
- Permalink
- Report Inappropriate Content
Generate a report from two other reports
Hello
On my sheet I have two table boxes that have the exact same columns. However, the data in these boxes are different. I'm trying to generate a new Table box that gets the differences between the two table boxes. That is show me in another box what is in the first box that is not in the second box. In SQL its like SELECT ID FROM A WHERE A.ID NOT IN (SELECT ID FROM B). Please is this possible? Thanks.
- « Previous Replies
-
- 1
- 2
- Next Replies »
Accepted Solutions
- Mark as New
- Bookmark
- Subscribe
- Mute
- Subscribe to RSS Feed
- Permalink
- Report Inappropriate Content
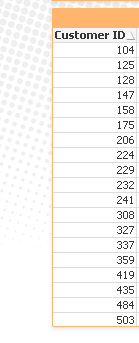
Create a straight table chart with dimension Tab1_customer_id and expression
=sum({<Tab1_customer_id /= p(Tab2_customer_id)>}1)
talk is cheap, supply exceeds demand
- Mark as New
- Bookmark
- Subscribe
- Mute
- Subscribe to RSS Feed
- Permalink
- Report Inappropriate Content
See this discussion: How to compare 2 tables and put non-matching results?
Or maybe this one: Intersection of List box values (it's not only about intersection)
talk is cheap, supply exceeds demand
- Mark as New
- Bookmark
- Subscribe
- Mute
- Subscribe to RSS Feed
- Permalink
- Report Inappropriate Content
I don't really understand and I'm retrieving these records from a MySQL data base using queries. But I want to edit a query on the sheet to exclude some values from another table.
- Mark as New
- Bookmark
- Subscribe
- Mute
- Subscribe to RSS Feed
- Permalink
- Report Inappropriate Content
With Qlikview you retrieve data from a source like MySQL and load that data into Qlikviews internal in-memory database. This is done with the select and/or load statements you build in the script editor. Once the data is loaded you can interact with the data using for sheet objects like list boxes and charts. Qlikviews internal in-memory database is not an SQL database. You can't query it with sql statements. So there is no query to edit.
Can you post a sample document with some data so one of us can show you a solution?
Preparing examples for Upload - Reduction and Data Scrambling
talk is cheap, supply exceeds demand
- Mark as New
- Bookmark
- Subscribe
- Mute
- Subscribe to RSS Feed
- Permalink
- Report Inappropriate Content
I have two sheet objects(Table boxes) That have this same column. The column in Table one is Tab1_customer_id and the column in table two is called Tab2_customer_id. I want to create a new sheet object that excludes records from table one. I mean I want to get all customer_ids from table one that are not in table two. Please help.
- Mark as New
- Bookmark
- Subscribe
- Mute
- Subscribe to RSS Feed
- Permalink
- Report Inappropriate Content
I tried using =if(Match(tot_customer_id,new_customer_id),Null(),tot_customer_id). But still does not give me the exact figure.
- Mark as New
- Bookmark
- Subscribe
- Mute
- Subscribe to RSS Feed
- Permalink
- Report Inappropriate Content
Create a straight table chart with dimension Tab1_customer_id and expression
=sum({<Tab1_customer_id /= p(Tab2_customer_id)>}1)
talk is cheap, supply exceeds demand
- Mark as New
- Bookmark
- Subscribe
- Mute
- Subscribe to RSS Feed
- Permalink
- Report Inappropriate Content
Hello sorry but this does not run, Whats the p for?
- Mark as New
- Bookmark
- Subscribe
- Mute
- Subscribe to RSS Feed
- Permalink
- Report Inappropriate Content
Works for me. See attached example.
The p is for Possible values.
talk is cheap, supply exceeds demand
- Mark as New
- Bookmark
- Subscribe
- Mute
- Subscribe to RSS Feed
- Permalink
- Report Inappropriate Content
I'm really sorry about this but I'm using the free version and I don't have the ability to open any documents again. Please can you copy and paste the solution here again. Thank you.
- « Previous Replies
-
- 1
- 2
- Next Replies »