Announcements
Qlik Connect 2024! Seize endless possibilities! LEARN MORE
hic
Former Employee
Former Employee

Do you belong to the group of people who think that Count(distinct…) in a chart is a slow, single-threaded operation that should be avoided?


If so, I can tell you that you are wrong.


Well - it used to be single-threaded and slow, but that was long ago. It was fixed already for – I think – version 9, but the rumor of its slowness lives on like an urban myth that refuses to die. Today the calculation is multi-threaded and optimized.


To prove that Count(distinct…) is faster than what many people think, I constructed a test which categorically shows that it is not slower – it is in fact a lot faster than the alternative solutions.


I created a data model with a very large fact table: 1M, 3M, 10M, 30M and 100M records. In it, I created a secondary key, with a large number of distinct values: 1%, 0.1% and 0.01% of the number of records in the fact table.


The goal was to count the number of distinct values of the secondary key when making a selection. There are several ways that this can be done:

  • Use count distinct in the fact table: Count(distinct [Secondary ID])
  • Use count on a second table that just contains the unique IDs: Count([Secondary ID Copy])
  • Use sum on a field that just contains ‘1’ in the second table: Sum([Secondary ID Count])


Data model.png


I also created a dimension ("Dim" in the “Dim Table”) with 26 values, also randomly assigned to the data in the fact table. Then I recorded the response times for three charts, each using “Dim” as dimension and one of the three expressions above. I made this for four different selections.
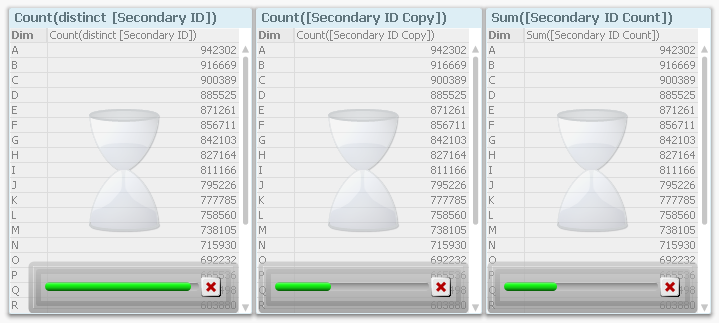
 

Progress bars.png


Then I remade all measurements using “Dim ID” as dimension, i.e. I moved also the dimension to the fact table. Finally, I loaded all the recorded data into QlikView and analyzed it.


The first obvious result is that the response time increases with the number of records in the fact table. This is hardly surprising…
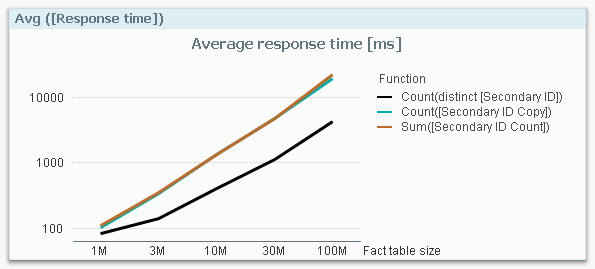
 

Avg response time.png


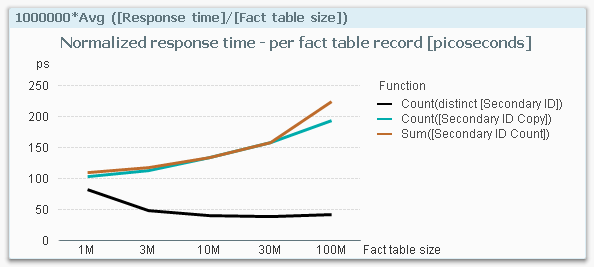
…so I need to compensate for this: I divide the response times with the number of fact table records and get a normalized response time in picoseconds:
 

Avg response time normalized.png


This graph is extremely interesting. It clearly shows that if I use a Count(distinct…) on the fact table, I have a response time that is considerably smaller than if I make a count or a sum in a dimensional table. The table below shows the numbers.


Comparison table.png


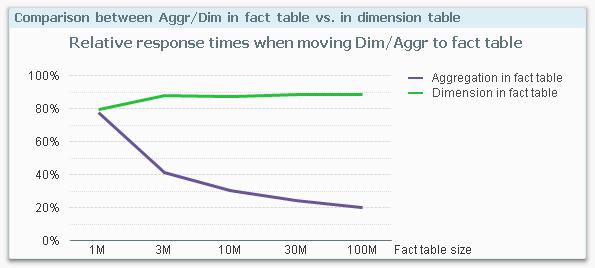
Finally, I calculated the ratios between the response times for having the dimension in the fact table vs. in a dimensional table, and the same ratio for making the aggregation in the fact table vs. in a dimensional table.
 

Comparison graph.png


This graph shows the relative response time I get by moving the dimension or the aggregation into the fact table. For instance, at 100M records, the response time from a fact table aggregation (i.e. a Count(distinct…)) is only 20% of an aggregation that is made in a dimensional table.


This is the behavior on my mock-up data on my four-core laptop with 16GB. If you make a similar test, you may get a slightly different result since the calculations depend very much on both hardware and the data model. But I still think it is safe to say that you should not spend time avoiding the use of Count(distinct…) on a field in the fact table.


In fact, you should consider moving your ID to the fact table if you need to improve the performance. Especially if you have a large fact table.


HIC

76 Comments
Anonymous
Not applicable

And the resurrection distracted me, so now I ain't got the vaguest recollection as to what I was looking up in the Help let alone why.

0 Likes
707 Views
Oleg_Troyansky
Partner Ambassador/MVP

Yeah, that whole article needs a lot of help (no pun intended). It looks like it was copied from the old Developer training manual without any further improvement...

0 Likes
707 Views
Anonymous
Not applicable

I want to believe, but to me Count DISTINCT is still a partially singelthreaded operation.

See video below.

It's a large application with 1.4 billion rows in the fact table.

Expression is a count(Distinct count_UserActivity_UserSID) on the fact table, where the field count_UserActivity_UserSID has overall about 50Mio distinct  values.

Barchart needs to be  calculated for ~24 Unique Months (two years).

The chart takes 35 seconds to calculate:

- At second 25 of the video I start calculating the bar chart

- CPU goes to 100% for 15 seconds.

- After that CPU takes another 20 seconds on a single core operation (8%) before the bar chart is finally drawn

20160802 2027 19 - YouTube

Video Link : 4525

0 Likes
707 Views
Anonymous
Not applicable

If the video does not work, follow this link 20160802 2027 19 - YouTube

0 Likes
707 Views
Oleg_Troyansky
Partner Ambassador/MVP

Hi Roland,

good input! Did you by any chance compare the performance of COUNT(DISTINCT) to the same calculation using sum(Counter) ? Is it any faster?

0 Likes
707 Views
Anonymous
Not applicable

Hi Oleg!

I must say I never understood how to implement Counter-Fields as alternatives to COUNT DISTINCT.

I mean, I have a billion-rows fact table, and I need to answer questions like:

- Distinct Customers per Month

- Distinct Customers per Day

- Distinct Customes per Year

This would mean, I have to create three different counter fields in the script- and that is quite expensive on a billion row fact table.

I just did a test with a simple COUNT instead of a COUNT DISTINCT on the same Dataset. The barchart returns after 7 seconds.

I can understand that a DISTINCT is more expensiv, what I don' understand is the Single-Core-Operation  when calculating the COUNT-DISTINCT-Chart.

0 Likes
707 Views
hic
Former Employee
Former Employee

Roland

All aggregations have a single-threaded phase, when the combinations are found and lookup tables are built. Count distinct is no different in this respect. It is the middle phase in a three-step evaluation:

Multithreading.png

In your case, this phase takes time because of the sheer amount of data. But the calculation - the actual counting - takes place in the third phase, which has several threads per aggregation.

So, the relevant question is the one Oleg poses: Is Sum(Counter) faster, slower or roughly the same? The Counter could e.g. be a field only containing "1" in your Customer master table. Then Sum(Counter) will count distinct customers.

HIC

757 Views
Anonymous
Not applicable

Hello Henric!

I now did

- a field "1 as DimUserCounter" in my Customer dimension

- changed the expression of the chart to sum (DimUserCounter)

Now the chart starts  "immediately" with the "Phase 2 single threaded operation". After 60 seconds the object hits the calculation limit (or in Qlik Sense Hypercube time limit)  of the Qlik Engine,. See video at: CalculationTimeOut small - YouTube

So this is definitely slower than the 35 seconds I had with COUNT DISTINCT.

Nevertheless my learning is:

- Count DISTINCT on my large dataset is 5 times slower than Count, because DISTINCT forces Qlik into a long single-threaded Phase 2 "Find values or combincations". Can you confirm this? 🙂 Currently I see no faster workaround for Count DISTINCT.

Thx,

Roland

0 Likes
757 Views
rwunderlich
Partner Ambassador/MVP

The performance of Count Distinct was "fixed" sometime in V9. My assumption was that some smart person realized that for a non-key field, counting the linked possible rows of a symbol table would give the distinct count. There was no need to do a "Distincting" operation.  

My tests on fact tables show that count(Distinct) slightly outperforms sum(counter).  So your results are very curious to me.

-Rob

http://masterssummit.com

http://qlikviewcookbook.com

757 Views
Anonymous
Not applicable

Rob,

I just validated with QlikView 11.20SR13 and I have exactly the same COUNT DISTINCT behavior (short Full CPU, long single Core operation).

  • Use any computer with about 32 GB of free RAM (the .qvw app will take about 23 GB).
  • Execute the script below and
  • Create a barchart with Dimension Month and count(distinct count_UserActivity_UserSID)

let vDim = 40000000;
let vMonths=36;

Dim:
load
'GUID'&rowno() as CustID,
'GUID'&rowno()&'@provider.com' as Email,
1 as DimUserCounter
autogenerate($(vDim));


Facts:
load
rowno() as Month
autogenerate($(vMonths));


outer join (Facts)
load
CustID,
CustID as count_UserActivity_UserSID
resident Dim;

Testdata is not very meaningful. The bar chart will show 40.000.000 for each month, but it should just demonstrate the CPU behavior.

0 Likes
757 Views