hic
Former Employee
Former Employee


In the QlikCommunity forum I have often seen people claim that you should minimize the number of hops in your Qlik data model in order to get the best performance.

I claim that this recommendation is not (always) correct.

In most cases, you do not need to minimize the number of hops since it affects performance only marginally. This post will try to explain when an additional table significantly will affect performance and when it will not.

The problem is which data model to choose:

Data Models Hops.png


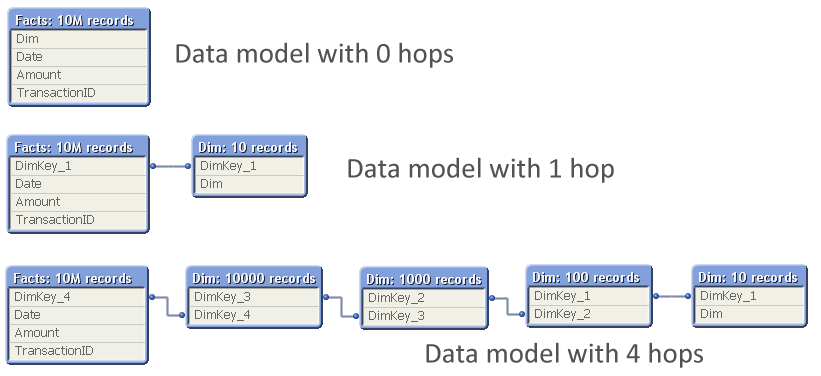
The question is: Should you normalize and have many tables, with several hops between the dimension table and the fact table? Or should you join the tables to remove hops?

So, I ran a test where I measured the calculation time of a pivot table calculating a simple sum in a large fact table and using a low-cardinality dimension, while varying the number of hops between the two. The graph below shows the result. I ran two series of tests, one where the cardinality of the dimensional tables changed with a factor 10 for each table; and one where it changed with a factor 2.

CalcTime vs NoOfHops.png


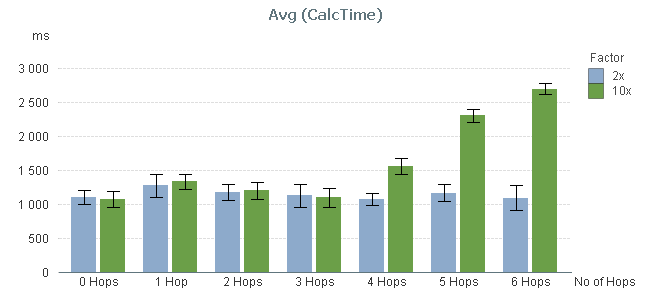
You can clearly see that the performance is not affected at all by the number of hops – at least not between 0 and 3 hops.

By 4 hops, the calculation time in the 10x series however starts to increase slightly and by 5 hops it has increased a lot. But this is not due to the number of hops. Instead, it is the result of the primary dimension table (the dim table closest to the fact table) getting large: By 5 hops it has 100.000 records and can no longer be regarded as a small table.

To show this, I made a second test: I measured the calculation time of the same pivot table using a fix 3-table data model, varying the number of records in the intermediate table, but keeping the sizes of the other tables.

Data Model Intermediate table.png


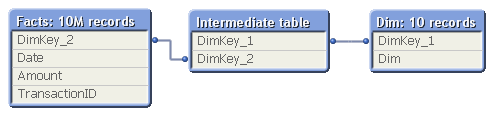
In real life, this structure would correspond to a part of a more complex data model, e.g.

  • Facts  -  Products  -  Product Groups
  • Order Lines  -  Order Headers  -  Customers

The result of my measurement can be seen in the red bars below:


CalcTime vs NoOfRecords Join.png


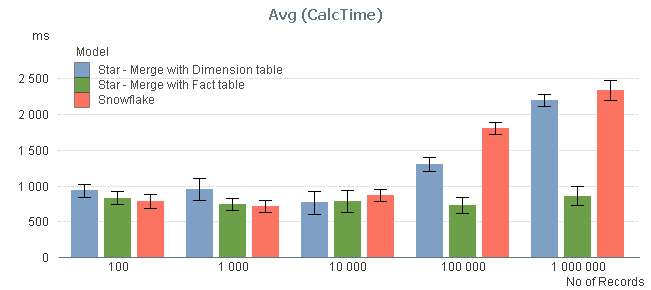
The graph confirms that the size of the intermediate table is a sensitive point: If it has 10.000 records or less, its existence hardly affects performance. But if it is larger, you get a performance hit.

I also measured the calculation times after joining the intermediate table, first to the left with the fact table, and then to the right with the dimension table, to see if the calculation times decreased (blue and green bars). You can see that joining tables with 10.000 records or less, does not change the performance. But if you have larger tables, a join with the fact table may be a good idea.

Conclusions:

  • The number of hops does not always cause significant performance problems in the chart calculation. But a large intermediate table will.
  • If you have both a primary and a secondary dimension (e.g. Products and Product Groups), you should probably not join them. Leave the data model as a snowflake.
  • If you have the facts in two large tables (e.g. Order Lines and Order Headers), you should probably join them into one common transaction table.

HIC


PS. A couple of disclaimers:

  1. The above study only concerns the chart calculation time - which usually is the main part of the response time.
  2. If the expression inside your aggregation function contains fields from different tables, none of the above is true.
  3. Your data is different than mine. You may get slightly different results.


Further reading related to this topic:

To Join or not to Join

37 Comments
vgutkovsky
Master II
Master II

Henric, I wrote an article about this a couple years ago: http://www.infinityinsight.com/blog/?p=164. I notified a greater improvement from denormalizing, even with low cardinality. Any thoughts on why you and I got different results? Is it purely a difference in testing methodology, or is there some data difference that's key?

Vlad

0 Likes
3,213 Views
AbhijitBansode
Specialist
Specialist

Thanks Henric Cronström for this valuable post.

Number of hops is no more a myth for me now.

0 Likes
3,213 Views
jcarpenter9
Partner - Creator
Partner - Creator

It isn't just in the Qlik Community forums that one hears this. Students in the QlikView Developer class also hear it, perhaps not in so many words, but in the repeated exercises to collapse and de-normalize the data model, and in the optimization chapter. This post and Henric's test results underscore the need to update the Developer training materials to reflect the new reality (or maybe, the reality that has been there all along). Perhaps QlikView did perform better in earlier years with fewer table hops...smaller, slower servers...earlier versions of QV...but this myth won't die easily unless we Certified Trainers receive updated information to teach.

As it is, I include several references to this blog when teaching QlikView Developer, pointing out where the current recommended practice disagrees with the course materials.

- James

3,213 Views
ChiragPradhan
Creator II
Creator II

Brilliant..! just what I was looking for. !! Thanks for sharing.

0 Likes
3,213 Views
rwunderlich
Partner Ambassador/MVP

Good comments James. As a fellow instructor, I share your frustration at the Dev curriculum not reflecting current understanding of how QV works. I'm hoping for an overhaul soon.

Great post HIC!

3,094 Views
ChiragPradhan
Creator II
Creator II

Hi Henric, Would really appreciate if you could post the method for calculating chart response/calculation times or perhaps the QVW?

0 Likes
3,094 Views
hic
Former Employee
Former Employee

Vlad

There are many factors that can influence this type of measurement. In my measurement I kept as much as possible constant, but still noticed that response times could vary ±30% (and more for the fast charts) from one series to another, although I made exactly the same sequence of selections on exactly the same data set. The only change was a restart of QlikView. So, yes, the testing methodology matters. As does the cardinality of the data.

Finally, I would expect a denormalized model to always be slightly more performant, so your results are reasonable. But the question is: Is the denormalized model significantly better? And is it worth the trouble and the loss of manageability? In your test, your worst chart (CH05) decreased from 78ms to 60ms. This is not enough to denormalize, as I see it.

HIC

0 Likes
3,094 Views
hic
Former Employee
Former Employee

James, Rob

Our training material has emerged from the empirical experience of a large number of implementations. I admit that we may not always have understood the reasons why things behave the way they do. So when we have formulated our experience in words, we have sometimes oversimplified things. The recommendation for a Star Scheme was probably an oversimplification, since no one made a systematic test (until last week).

The training material will most likely be changed.

However, I think that the recommendation is still a good one. A simplification, yes, but a Star Scheme is performant and reasonably manageable. It is a good compromise. The goal with my blog post was to give a deeper understanding for those who want a deeper understanding – which is far from everyone. So I think that this recommendation has been useful.

HIC

0 Likes
3,094 Views
hic
Former Employee
Former Employee

Chirag

See Recipe for a Memory Statistics analysis. In this app, there is a field CalcTime, that is an approximate calculation time for objects that I use.

However, you need to clear the cache before doing it. See http://community.qlik.com/blogs/qlikviewdesignblog/2014/04/14/the-qlikview-cache#comment-16263

HIC

3,094 Views
vgutkovsky
Master II
Master II

Henric, I completely agree. I wrote that article more as an example of what can be accomplished by taking denormalization to extremes. As you correctly point out though, it would be a nightmare to maintain such an application. Definitely not advocating that.

Good post as always, love reading your stuff!

Vlad

0 Likes
3,094 Views