Announcements
Qlik Connect 2024! Seize endless possibilities! LEARN MORE
elif-tutuk
Former Employee
Former Employee

We all use QlikCommunity when we need an answer for a QlikView question. We post a question and get an answer, usually in minutes, leveraging the expertise of 91,000+ QlikView users! QlikCommunity is the most-visited and active user community in the BI industry.

I also use QlikCommunity. And sometimes not to get an answer for a question but to think about new ways of doing things by reading the answers on the existing posts. So I have been curious about the answers on calculating the accumulative sums in QlikView and did a search on QlikCommunity. There are many answers provided as expected. Here is one way of achieving it by using rangesum() and aggr() functions.

It is a very common requirement to display the accumulative sum of a chart metric. The easiest way of doing this is to use the accumulate setting under the expressions tab of chart property.
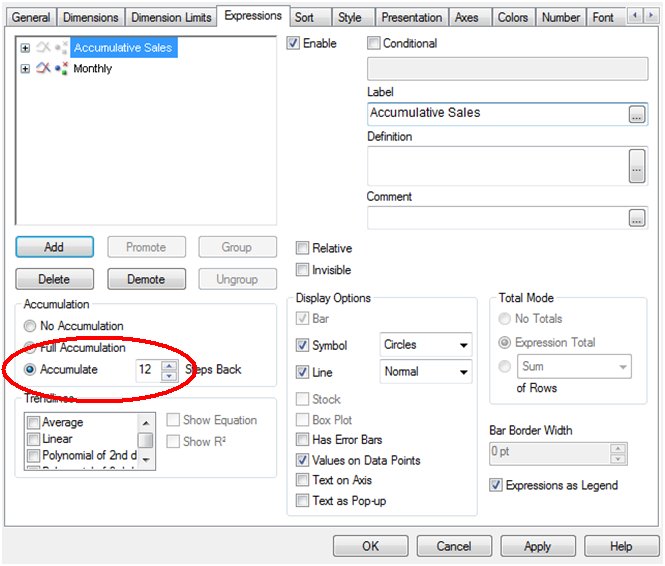
Chart accumulation (2).jpg

Figure 1. Accumulate option on chart property

With this setting, the values of the selected metric will be accumulated. But sometimes, the requirement is to have the first data point accumulated as well. For example, to show the accumulated sales for 12 months where the first month displayed should be the sum of the previous 12 months and the following months should accumulate on top of this value by adding one month at a time. One way of achieving this is to use the rangesum() and the aggr() functions together.

Let us first look at Rangesum(). It is a range function that returns the sum of a range of 1 to N arguments Together with the above() function, you can calculate the sum of the last 12 months;

rangesum( above( sum(Sales),0,12) )

This expression will return the sum of sales evaluated for each month as they appear on the 12 rows above the current row.

The next step is to combine RangeSum() with  the aggr() function to aggregate the sum of sales for the 12 months at the month level.

sum( aggr( rangesum( above( sum(Sales),0,12) ),Month))

Using the Aggr() function, it is possible to calculate the accumulated sum for any other dimensions in addition to  the time dimension. For example, the 12 months accumulated sum of sales by store can be calculated as;

sum( aggr( rangesum( above( sum(Sales),0,12) ),Month, Store))

Optionally you could also clear any selections on the month field as the calculation should reflect the accumulated sales for the previous 12 months, regardless of selections. This is achieved by using the set analysis “{$<Month>}”.

sum( aggr( rangesum( above( sum( {$<Month>}  Sales),0,12) ),Month))

One important thing to notice with this solution is the sort order inside the aggr() function. If the sort order is not correct, the aggregated sum of the 12 months would not be correct. QlikView always sorts the groupings (in this case the groups defined by the second parameter of the aggr() function) according to the load order. If the data is sorted by date during the load, QlikView will use this order and the aggr() function will show the correct totals for the desired time frame.

In summary, the accumulation option on the expression tab is the simplest way of achieving accumulations, but the use of rangesum() and aggr() functions are alternative ways of accumulating the data in more complex situations.

33 Comments
Not applicable

Thank you for the great post!

I have a bubble graph with three expressions and one dimension:

  • X-axis: total price -> sum(Price)
  • Y-axis: price per unit -> sum(Price)/sum(Quantity)
  • Bubble: total Quantity -> sum(Quantity)
  • Dimension: Category

Now I want to animate this bubble graph based on time("period").I want to use the accumulated Price and Quantity to calculate the price per unit. However, the "Full Accumulation" in the Expressions tab adds up the price per unit for each period, which is not what I want. I came across your post and tried the following expression for the Y-axis:

  • sum( aggr( rangesum( above( sum(price),0,3) ),Period, Category)) / sum( aggr( rangesum( above( sum(Quantity),0,3) ),Period, Category))

But this gives me the price per unit based on each period's data instead of cumulative data. I have attached a qlikview example for reference (in this link). I would like the animated graph to resemble the total price graph on top when the animation reached period 3 (currently, the price per unit is not showing correctly).

Any help would be greatly appreciated!

0 Likes
7,819 Views
orabrabbo
Partner - Contributor II

You will find the solution at the following link...http://community.qlik.com/message/482450#482450

0 Likes
7,819 Views
punitpopli
Specialist
Specialist

Hi Elif Tutuk :

Thanks for this superb post.

Is there a way where we can found the Avg of the rolling months, as the above post is based on Sum.

I have tried using Avg function but it didn;t work, so just thought to reply to this post

Thanks in Advance

-Punit

0 Likes
7,777 Views
orabrabbo
Partner - Contributor II

Hi,

give me, please, a concrete example of what you want to do about the data source and data target.

Thank's

0 Likes
7,777 Views
punitpopli
Specialist
Specialist

Hi antonino barbaro

I was actually looking for rolling average for last 4 week (in our case) and so on, in the same way as rolling sum mentioned above for rangesum. I had achieve it by using RangeAvg

e.g. : rangeavg( below( sum(Sales),0,4) )


Thanks

Punit

7,777 Views
orabrabbo
Partner - Contributor II

You can also use the following expression:

rangeavg( above( sum(sale),0,4) )

7,777 Views
Not applicable

Hi Elif:

Great post!!

I have a question when I try to calculating the Rolling 12 month leavers.

I have records for each leavers, there are leave dates and leave types etc.

When I use your method, I found out that it works fine as long as there is data for the particular month.

I mean the expression works for rolling 12 month total leavers because there are leavers for each month.

But when I calculate the rolling 12 month leavers for a particular leave type, if there is no leavers for the type in a month, the result would be 0 for the month instead of total for the last 12 month.

I wish you understand my issue and provide me some guidance about the solution for this issue.

Thank you very much.

PC

0 Likes
7,777 Views
punitpopli
Specialist
Specialist

Hi etk‌, Orabrabbo

I am using the below formula in one of the line chart for 53 weeks to calculate rolling 4 week average .

IF(Count({$<WeekId={'>$(=max({1}WeekId)(53))'}>}sales)>0, RangeAvg(Above(sum(sales),0,4)), null())


But in my case I have a cyclic group icon on z-axis and in that case this above exp is not returning the correct result.


Is their a way to include cyclic group in the expression?


Thanks,

Punit

0 Likes
7,777 Views
Not applicable

Hi Punit:

Cyclic groups can be used in calculations by using square bracket and GetCurrentField.

For example:

[$(=GetCurrentField(YourCyclicGroup))]

Consider the whole thing as a field with square bracket when using in calculations should be OK.

Thank you.

PC

7,603 Views
alknirmal1
Partner - Contributor III

Hi,

Thank you very much for this post .. It really helps !!

The  expression sum( aggr( rangesum( above( sum( {$<Month>}  Sales),0,12) ),Month)) is working fine only if the month is in sorted order .. i tried to load teh data and then sort in qlikview script. But it doesnt work fine .. Anyone knows how to handle this scenario and make it to work if the data is alreay not in sorted order ?


your help is very much appreciated ..


Thanks,

Nirmal.

0 Likes
7,603 Views