Announcements
Qlik Connect 2024! Seize endless possibilities! LEARN MORE
elif-tutuk
Former Employee
Former Employee

We all use QlikCommunity when we need an answer for a QlikView question. We post a question and get an answer, usually in minutes, leveraging the expertise of 91,000+ QlikView users! QlikCommunity is the most-visited and active user community in the BI industry.

I also use QlikCommunity. And sometimes not to get an answer for a question but to think about new ways of doing things by reading the answers on the existing posts. So I have been curious about the answers on calculating the accumulative sums in QlikView and did a search on QlikCommunity. There are many answers provided as expected. Here is one way of achieving it by using rangesum() and aggr() functions.

It is a very common requirement to display the accumulative sum of a chart metric. The easiest way of doing this is to use the accumulate setting under the expressions tab of chart property.

Chart accumulation (2).jpg

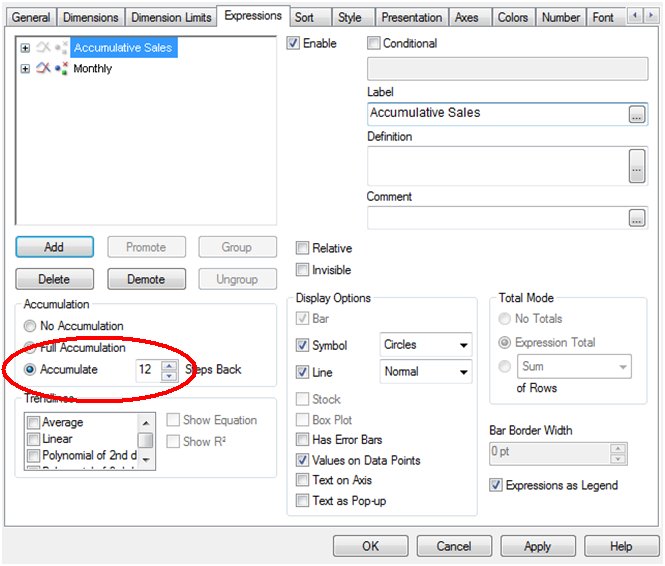
Figure 1. Accumulate option on chart property

With this setting, the values of the selected metric will be accumulated. But sometimes, the requirement is to have the first data point accumulated as well. For example, to show the accumulated sales for 12 months where the first month displayed should be the sum of the previous 12 months and the following months should accumulate on top of this value by adding one month at a time. One way of achieving this is to use the rangesum() and the aggr() functions together.

Let us first look at Rangesum(). It is a range function that returns the sum of a range of 1 to N arguments Together with the above() function, you can calculate the sum of the last 12 months;

rangesum( above( sum(Sales),0,12) )

This expression will return the sum of sales evaluated for each month as they appear on the 12 rows above the current row.

The next step is to combine RangeSum() with  the aggr() function to aggregate the sum of sales for the 12 months at the month level.

sum( aggr( rangesum( above( sum(Sales),0,12) ),Month))

Using the Aggr() function, it is possible to calculate the accumulated sum for any other dimensions in addition to  the time dimension. For example, the 12 months accumulated sum of sales by store can be calculated as;

sum( aggr( rangesum( above( sum(Sales),0,12) ),Month, Store))

Optionally you could also clear any selections on the month field as the calculation should reflect the accumulated sales for the previous 12 months, regardless of selections. This is achieved by using the set analysis “{$<Month>}”.

sum( aggr( rangesum( above( sum( {$<Month>}  Sales),0,12) ),Month))

One important thing to notice with this solution is the sort order inside the aggr() function. If the sort order is not correct, the aggregated sum of the 12 months would not be correct. QlikView always sorts the groupings (in this case the groups defined by the second parameter of the aggr() function) according to the load order. If the data is sorted by date during the load, QlikView will use this order and the aggr() function will show the correct totals for the desired time frame.

In summary, the accumulation option on the expression tab is the simplest way of achieving accumulations, but the use of rangesum() and aggr() functions are alternative ways of accumulating the data in more complex situations.

33 Comments
anderseriksson
Partner - Specialist

Very nice but there is a flaw with this!

Aggr builds a temporary table that works the same way as a straight table.

If there are no sales in a month then the Above inside Aggr will go back one more month.

It's more obvious with rolling 3 months, the expression;

sum( aggr( rangesum( above( sum( {$<Month>}  Sales),0,3) ),Month))

Say we are closed for July thus selling $0 or by user selection there is no data in July.
Then for August it would aggregate aug+jun+may instead of aug+(jul)+jun,

September would add together sep+aug+jun instead of sep+aug+(jul).

We need the expression to evaluate a value each period regardless if there are data in that period or not.

I have managed though to overcome this problem using the following expression.

It also does away with using Aggr but can be a little hard to understand.

Include inside Above is the strange Sum({1}0) which ensures there is a calculated
value each month even for July in my example above.

But since the sums inside the RangeSum calculates for all months regardless

of selection we need to limit the result to only the selected months.

Here the Count(...) helps by calculating 1 in selected months and 0 for the other months.

Tried using Sum() or Only() but that does not work.

Using P(Month) in the set-analysis won't work since that would again obscure July in my example.

Values would be correct but July omitted even though it should add (jul)+jun+may

Count({1<Month={">=$(=Min(Month))<=$(=Max(Month))"}>} DISTINCT 1) *
RangeSum(Above(Sum({1}0) + Sum({$<Month>} Sales), 0, 3))

7,575 Views
qlikviewwizard
Master II
Master II

Good post. Thank you for sharing...

0 Likes
7,575 Views
Not applicable

No of the aforementioned worked for me, anyway thanks for posting!

0 Likes
7,575 Views
pascaldeclarens
Contributor
Contributor

Hello,

many thanks for your help.

I am afraid that this did not solve my problem...

I used the sum( aggr( rangesum( above ( sum {$<Month>}[Total HT Net],0,12) ),Month)) (with or without the month check)

note: in my case the field name I want to cummulate is called 'Total HT Net'

And I get a line with value= 0

I enclose below the chart, below is the linechart with montly sales for years 2016 and 2016, at the top is the line chart using the rangesum function

Capture d’écran 2016-09-18 à 09.37.25.png

Where am I wrong?

thanks

0 Likes
7,575 Views
Tyler_Waterfall
Employee
Employee

pascaldeclarens‌ - a late reply, but can you check your measure? it looks like it is missing some ( and ) around the SUM

You posted:

sum( aggr( rangesum( above ( sum {$<Month>}[Total HT Net],0,12) ),Month))


Try this?


sum(

     aggr(

          rangesum(

               above (

                    sum ( {$<Month>} [Total HT Net] )

               ,0,12)

           )

     ,Month)

)

0 Likes
7,507 Views
timmarsh
Contributor III
Contributor III

How would you calculate an accumulation to the beginning of time?

Imagine I am plotting a % of something across time.

Each month I have a number of something - it changes each month. Emergency Department presentations.

I want to compare it (denominator) to something else - number of patients enrolled in a program - which I want to accumulate across, but I want the accumulation back to me first data point?

That means, I want to compare that month's ED presentations to an accumulated (to that point) sum of patient records.

Starting from here: =sum(Unique_ED_Presentations)/sum(Patient_Record_Counter).

Can't paste data, health data.

Thanks for any help!

Tim

0 Likes
7,507 Views
gr_eldred
Creator II
Creator II

I have 52 weeks of the year 2017 in a simple table

I want to add 6 weeks sales.

111.png

I'm just bringing the last 6 weeks of information, what I need is that in each week I get the total of the sum of 6 weeks ago.

sum({$<Status-={'C'}, SemamaAñoApple_Numerado = {">=$(=Max(SemamaAñoApple_Numerado)-6)<=$(=Max(SemamaAñoApple_Numerado))" }, Año={$(=only(Año))}>} Cantidad)

Example:

Week 6 must bring the sum of 6 weeks back (week1 + week2 + week3 + week4 + week5 + week6)

Week 7 has to show the sum of 6 weeks ago (week2 + week3 + week4 + week5 + week6 + week7)

0 Likes
7,507 Views
anderseriksson
Partner - Specialist

Well you can't do it with set analysis.
An important insight about set analysis is that it is applied to your data set before the calculations in your table.

You have the original data set in the application filtered through the users selection.
On that the set analysis is applied altering the filtering and producing a new data set.
This data set is then used in the calculation.

What this means is the set analysis does not take into account your dimensions in the table because the set analysis is applied once for the whole column (or row since you have turned it around).

After the set analysis is applied, the expression is calculated for each cell using the resulting data set.

So what your set analysis does above (with my limited Spanish) is to take the maximum WeekYear (SemamaAñoApple_Numerado) and filter your data to include the maximum WeekYear and six week before.

You need instead to use expressions that reference the six weeks before in your table and there is where functions RangeSum and Above comes in.

Above lets you calculate the expression and get the result if you had been in previous cell (or more cells back depending on your parameters).

You can then combine results from Sum in the current cell with Sum if you had been in those previous cells to get the result you are looking for.

Start easy with just using Above once and see that you get the Sum for previous week.
Then expand on that until you have what you are looking for.

Forget about set analysis and trying to filter what each individual cell is calculating because that's not the way it works.

You might need set analysis to expand the time frame to include six weeks before your users selections to get the first cells correct.
Otherwise you will get a ramping effect for the first six cells.

0 Likes
7,507 Views
davidoxi
Contributor III
Contributor III

Hi ,

I have the following calculation formula :

sum(Aggr(count(if(match([Type de commande], 'URGENT','GROS', 'PVI'), [N° ligne])),[N° donneur d'ordre]))/Aggr(sum(Aggr(count([N° ligne]),[N° de commande])),[N° donneur d'ordre]) ;

I want to chart Chart line by Last 6 Months

7,507 Views
gr_eldred
Creator II
Creator II

Thank you

0 Likes
7,507 Views