Unlock a world of possibilities! Login now and discover the exclusive benefits awaiting you.
- Subscribe to RSS Feed
- Mark as New
- Mark as Read
- Bookmark
- Subscribe
- Printer Friendly Page
- Report Inappropriate Content
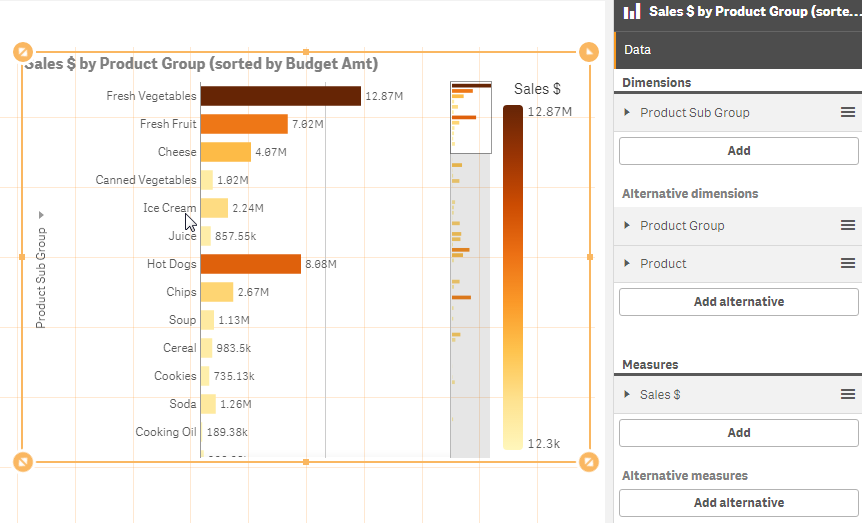
In Qlik Sense, alternate dimensions and measures are available providing users the option to change the dimensions and/or measures being used in a chart. Alternate dimensions and measures are defined in advance and provide users with different views of the data all in one chart. Alternate dimensions and measures can be added to a visualization in the Properties panel. In the image below, there is a bar chart with Product Sub Group as the dimension and Sales $ as the measure. There are also two Alternative dimensions: Product Group and Product. Alternate dimensions and measures can be added by clicking the Add alternative button and selecting or entering the new dimension or measure.
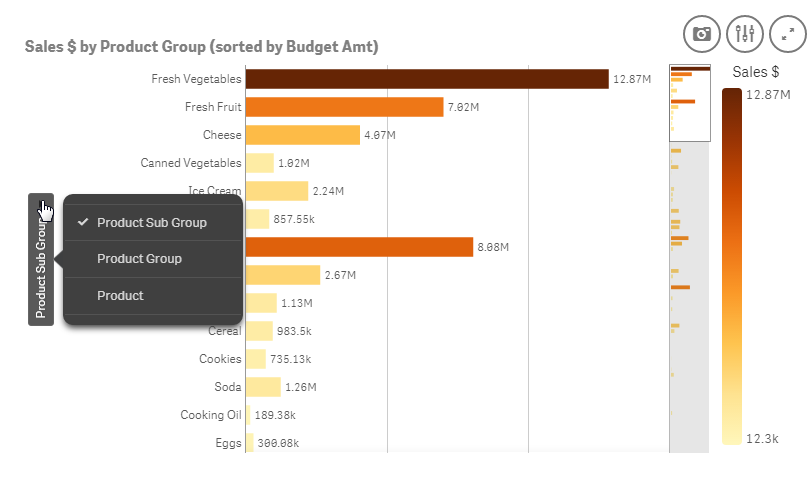
By default, the bar chart above shows the Sales $ by the main dimension for the chart, Product Sub Group. Since there are alternative dimensions set up, the user can also view the Sales $ by Product Group or Product by simply clicking the arrow next to the dimension name on the y-axis and selecting either Product Group or Product.
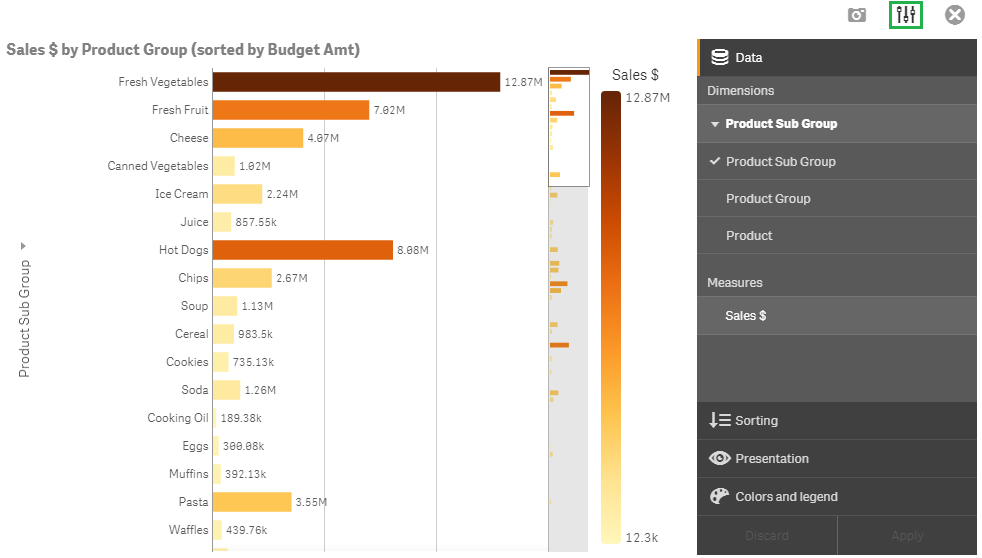
In Qlik Sense 3.0, the ability to change the dimension from the axis was added. Users can also change the dimension or measure by opening the Exploration Menu and changing the dimension or measure.
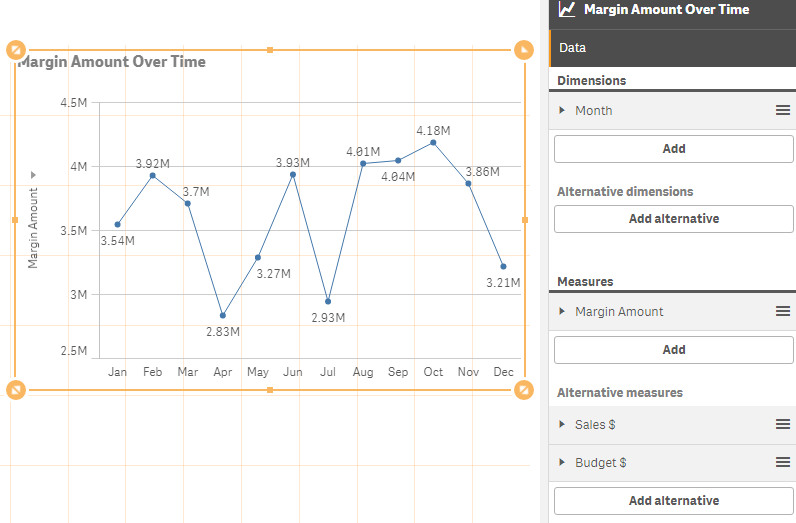
Adding alternate measures is just as easy. In the image below, two alternate measures were added to the Margin Amount Over Time line chart: Sales $ and Budget $.
A few things to be aware of when using alternate dimensions and measures:
- In bar, line and combo charts, the title needs to be visible on the axis of the alternate dimension/measure so the user can see the arrow to click on to change the dimension/measure. If you prefer not to show the title, then the user can still change the dimension/measure by going into the Exploration Menu.
- Alternate dimensions and measures can be added to all chart types but they can only be changed in the visualization (via the axis) in bar, line and combo charts. In other chart, they can be changed in the Exploration Menu.
If you are familiar with QlikView, you may find alternate dimensions and measures to be similar to the cyclic group that is available in QlikView. They are both great features because it allows the user to have one visualization with numerous views. This is ideal in keeping your sheets uncluttered. Instead of having the same visualization repeated using different dimensions or measures, you can now have one chart with alternate dimensions and/or measures.
Thanks,
Jennell
- « Previous
-
- 1
- 2
- Next »
You must be a registered user to add a comment. If you've already registered, sign in. Otherwise, register and sign in.