hic
Former Employee
Former Employee

To make a chart in QlikView – in any Business Intelligence tool, for that matter – you need to have one or several dimensions; entities with discrete values that you use as grouping symbols. But where should you define these dimensions: In the script or in the object where the dimension is used?

In most cases, you will use an existing field as dimension, i.e. an attribute that exists in the source data. In such a case, the answer to the above question is easy: Just make sure to load the field in the script, and you're done.

But in some cases you want to use derived attributes: Attributes that do not exist in the source data but one way or another can be calculated from existing fields.

One example is the fields of the Master Calendar: Year, Month, etc. These can all be derived from a date found in the source data:

   Month(Date) as Month

   Year(Date) as Year

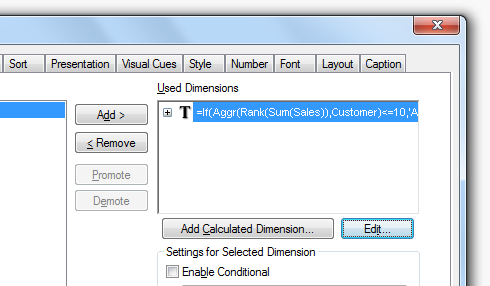
A more advanced example is if you want to classify or rank a field. The following expression returns ‘A’ for the 10 best customers and a ‘B’ for the rest:

   If(Aggr(Rank(Sum(Sales)),Customer)<=10,'A','B')

For such fields the above question is very relevant: Should they be calculated in the script and saved as fields, or should they be calculated on the fly in a sheet object?

Image2.png


There are pro:s and con:s with both approaches: A field calculated in the script is calculated once and for all, so it does not need to be re-calculated every time the user clicks. Hence, response times will be slightly shorter if the field is calculated in the script.

On the other hand, in some cases you want the field to be re-calculated every time the user clicks. A good example is the classification using Rank() above. Most likely you want this field to depend on the selection made: If you have selected a product, you want to see the classification of the customers given this selection. Such a number is in its nature dynamic and should be calculated every time the user clicks.

The key is whether the calculated field should be static or dynamic. The field Month is static: A specific date always belongs to the same month, irrespective of user selection. As opposed to a classification or a rank where the calculation usually should be dynamic, since the result potentially could change every time the user clicks.

Bottom line is that dynamic fields must be calculated in the chart or the list box. But for static fields it is better if they are calculated in the script, since precious CPU-time otherwise will be unnecessarily spent every time the user clicks.

HIC


Note: The Rank() function cannot be used in the script, so if you want to calculate a static rank in the script, you need to do it in a different way, using e.g. a combination of Order By and RecNo().


Further reading related to this topic:

Buckets

25 Comments
kalyandg
Partner - Creator III

hi HIC,

nice

13,694 Views
Not applicable

Thank you for sharing this valuable insight.

0 Likes
13,694 Views
nicolett_yuri

Good!!

0 Likes
13,694 Views
IAMDV
Luminary Alumni
Luminary Alumni

Thanks HIC. No doubt Calculations Dimensions have their place for usage. What are the implications on caching when we use the Calculated Dimension? I guess it would have negative impact on the cache..?

Thanks,

DV

0 Likes
13,694 Views
hic
Former Employee
Former Employee

Yes, they have an impact on the cache. But I wouldn't say that it is negative... The result of a calculated dimension will be stored in the cache and re-used properly. Which means that if you have the same data set, the same selection and the same expression, a look-up will be made in the cache to save CPU-time.

HIC

13,694 Views
Not applicable

Hi, thanks HIC! Its Good!.

0 Likes
13,694 Views
Not applicable

Hi Nice Thanks.

0 Likes
11,065 Views
Not applicable

Good to know this, i always heard that calculated dimensions wont cache hence it impacts performance. So can we safely assume calculated dimensions cache equivalent to regular dimensions?

0 Likes
11,065 Views
hic
Former Employee
Former Employee

Calculated dimensions are definitively cached, just as any expression..

It is true that calculated dimensions sometimes are heavy to calculate, and thus impact performance. But if so - the more reason to cache them!

HIC

11,065 Views
Not applicable

Thanks Henric, good post.

I wanted to achieve this, but as a Qlikview beginner, I wasn't sure how to do it.

Specifically I wanted to show a List View of States (in US), but only show the States with the top 5 sales.

  1. My first instinct was, "Dimension limits", but these only apply in Chart Tables, not in List Views. Correct that Dimensnion limits could only help in Chart Tables?
  2. My second instinct was, "Set analysis", because my problem suggets a solution which can "filter"; Set analysis allows me to filter with Modifier expression. I was thinking something like AGGR(ONLY( {1 <Sum(SALES) = { '> $FifthHighestSales' } > } ) ). But I don't think Set analysis is appropriate because it doesn't work on aggregations. i.e. above gives "Error: Error in set modifier expression" Correct that set analysis is not the right tool for my problem? NOTE: Henric pointed out correct syntax below; the problem is that I used SUM(Sales) as the identifier; however, the SUM(SALES) Expression should be inside the modifier (i.e. between the brackets). Set can be used to solve the problem.
  3. So I finally found your post here, and this post here. You made it clear how to solve the problem. I have only one curiosity, the IF condition: AGGR(RANK(SUM(SALES))) >=10 . I thought AGGR produces a set (i.e. multiple ) of values, whereas 10 is only a scalar (i.e. single value) . How is this statement evaluated? Is AGGR indeed producing a set? Or maybe AGGR is producing only a single value since the entire thing is evaluated as a Dimension, one-dimension-value-at-a-time? I hope my question is clear...
0 Likes
11,065 Views