Unlock a world of possibilities! Login now and discover the exclusive benefits awaiting you.
- Subscribe to RSS Feed
- Mark as New
- Mark as Read
- Bookmark
- Subscribe
- Printer Friendly Page
- Report Inappropriate Content
In most cases, you will use an existing field as dimension, i.e. an attribute that exists in the source data. In such a case, the answer to the above question is easy: Just make sure to load the field in the script, and you're done.
But in some cases you want to use derived attributes: Attributes that do not exist in the source data but one way or another can be calculated from existing fields.
One example is the fields of the Master Calendar: Year, Month, etc. These can all be derived from a date found in the source data:
Month(Date) as Month
Year(Date) as Year
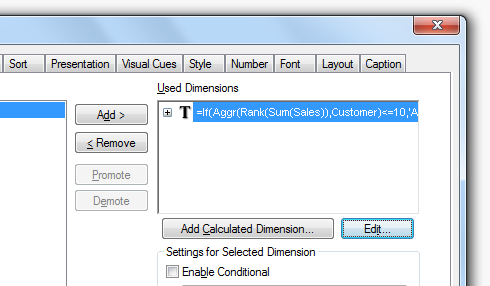
A more advanced example is if you want to classify or rank a field. The following expression returns ‘A’ for the 10 best customers and a ‘B’ for the rest:
If(Aggr(Rank(Sum(Sales)),Customer)<=10,'A','B')
For such fields the above question is very relevant: Should they be calculated in the script and saved as fields, or should they be calculated on the fly in a sheet object?

There are pro:s and con:s with both approaches: A field calculated in the script is calculated once and for all, so it does not need to be re-calculated every time the user clicks. Hence, response times will be slightly shorter if the field is calculated in the script.
On the other hand, in some cases you want the field to be re-calculated every time the user clicks. A good example is the classification using Rank() above. Most likely you want this field to depend on the selection made: If you have selected a product, you want to see the classification of the customers given this selection. Such a number is in its nature dynamic and should be calculated every time the user clicks.
The key is whether the calculated field should be static or dynamic. The field Month is static: A specific date always belongs to the same month, irrespective of user selection. As opposed to a classification or a rank where the calculation usually should be dynamic, since the result potentially could change every time the user clicks.
Bottom line is that dynamic fields must be calculated in the chart or the list box. But for static fields it is better if they are calculated in the script, since precious CPU-time otherwise will be unnecessarily spent every time the user clicks.
Note: The Rank() function cannot be used in the script, so if you want to calculate a static rank in the script, you need to do it in a different way, using e.g. a combination of Order By and RecNo().
Further reading related to this topic:
- « Previous
- Next »
You must be a registered user to add a comment. If you've already registered, sign in. Otherwise, register and sign in.