hic
Former Employee
Former Employee


A common situation when loading data into a Qlik document is that the data model contains several dates. For instance, in order data you often have one order date, one required date and one shipped date.
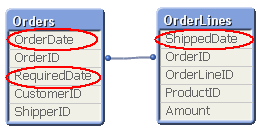
 

Base model.png


This means that one single order can have multiple dates; in my example one OrderDate, one RequiredDate and several ShippedDates - if the order is split into several shipments:


Logic 1.png


So, how would you link a master calendar to this?


Well, the question is incorrectly posed. You should not use one single master calendar for this. You should use several. You should create three master calendars.


The reason is that the different dates are indeed different attributes, and you don’t want to treat them as the same date. By creating several master calendars, you will enable your users to make advanced selections like “orders placed in April but delivered in June”. See more on Why You sometimes should Load a Master Table several times.


Your data model will then look like this:
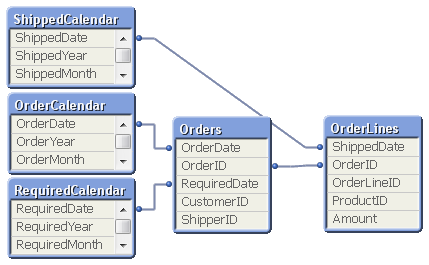
 

Model with spec calendars.png


But several different master calendars will not solve all problems. You can for instance not plot ordered amount and shipped amount in the same graph using a common time axis. For this you need a date that can represent all three dates – you need a Canonical Date. This is how you create it:


First you must find a table with a grain fine enough; a table where each record only has one value of each date type associated. In my example this would be the OrderLines table, since a specific order line uniquely defines all three dates. Compare this with the Orders table, where a specific order uniquely defines OrderDate and RequiredDate, but still can have several values in ShippedDate. The Orders table does not have a grain fine enough.


This table should link to a new table – a Date bridge – that lists all possible dates for each key value, i.e. a specific OrderLineID has three different canonical dates associated with it. Finally, you create a master calendar for the canonical date field.
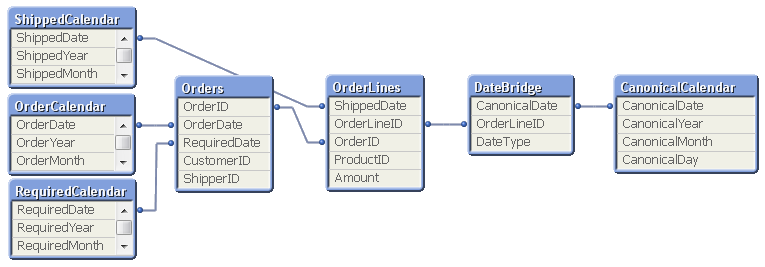
 

Full model.png


You may need to use ApplyMap() to create this table, e.g. using the following script:


     DateBridge:
     Load
          OrderLineID,
          Applymap('OrderID2OrderDate',OrderID,Null()) as CanonicalDate,
          'Order' as DateType
          Resident OrderLines;

     Load
          OrderLineID,
          Applymap('OrderID2RequiredDate',OrderID,Null()) as CanonicalDate,
          'Required' as DateType
          Resident OrderLines;

     Load
          OrderLineID,
          ShippedDate as CanonicalDate,
          'Shipped' as DateType
          Resident OrderLines;


If you now want to make a chart comparing ordered and shipped amounts, all you need to do is to create it using a canonical calendar field as dimension, and two expressions that contain Set Analysis expressions:


     Sum( {$<DateType={'Order'}>} Amount )
     Sum( {$<DateType={'Shipped'}>} Amount )
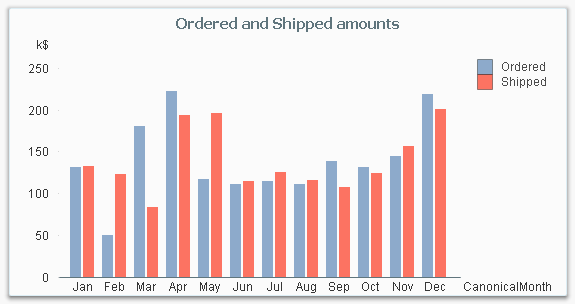
 

Bar chart.png


The canonical calendar fields are excellent to use as dimensions in charts, but are somewhat confusing when used for selections. For this, the fields from the standard calendars are often better.


Summary:

  • Create a master calendar for each date. Use these for list boxes and selections.
  • Create a canonical date with a canonical calendar. Use these fields as dimension in charts.
  • Use the DateType field in a Set Expression in the charts.


A good alternative description of the same problem can be found here. Thank you, Rob, for inspiration and good discussions.


HIC

192 Comments
hic
Former Employee
Former Employee

The first step is to create the two mapping tables: OrderID2OrderDate and OrderID2RequiredDate. These are created from the Orders table, i.e. one record per order.

Then I create the bridge table using the OrderLines table, i.e. one record per OrderLineID. This table also contains the OrderID, which is used to get the two dates from the mapping tables. This way I can link the OrderLinesID to the OrderDate and the RequiredDate.

HIC

0 Likes
1,148 Views
adamdavi3s
Master
Master

Hi Henric,


What sort of performance implications does this have?

I am just playing with a dashboard which has a 9m row fact and 5 dates, so the bridge is 45m rows.

The dashboard behaves as expected until I start drilling down to a small subset, say 50- 100 rows and then it really starts to grind.

This is the first time I've tried this method rather than disparate facts and a link table

0 Likes
1,148 Views
hic
Former Employee
Former Employee

The bridge table can indeed become very large and this can affect performance.

However, in your case it sounds like something else. First, 45m records is not that much for modern computer with plenty of RAM. Secondly, you say that it is slower when you drill down to a small subset. It's usually the other way around: When you have reduced it to a small subset, it's faster.

So, I really can't say what it could be, without looking at the app.

HIC

0 Likes
1,166 Views
adamdavi3s
Master
Master

Hi Henric,


Thank you for coming back to me.

You're quite right and it was something else, a calculated dimension.

I thought it weird that the system slowed up as selections were made as this wasn't behavior I had experienced before.

When asking on the community what the issue could be, someone had suggested that it could be the size of the bridge table and the way the calculation engine was working, hence the question, but I am pleased to say that the app is now running very smoothly and I am really liking this method of working with dates.

1,166 Views
Not applicable

Hi HIC,

I have 22 different dates within my data model spread across Targets, Working Leads, Accounts, Marketing Funds, and Sales. All dates can relate back to an Account. I am wondering what my table would be the would correspond to the OrderLines Table? This way I can create my DateBridge Table? I have created master calendars for all 22 dates (seems excessive, but you never know what people will want to filter on). Also since they all can relate back to an account they may want to be looked at over the same time period (i.e. Accounts Lost verse Accounts Sold or Account Sales verse Account Marketing Funds - over time)..I am also working within Qlik Sense if this makes a difference.

Thanks

Madison

0 Likes
1,166 Views
hic
Former Employee
Former Employee

Can an account have several possible values of a specific date, e.g. the sales date? If so, Account is not the right field to use.

You need to find the table that is the "lowest" one in the hierarchy - a table where a record never links to more than one "parent" (or record in another table). This table is a good candidate to use for the date bridge.

Whether it is QlikView or Qlik Sense doesn't matter. Same logic.

HIC

0 Likes
1,166 Views
Not applicable

hic‌, how do I join dates across 2 tables for a CanonicalDate. For example in my example, I have 3 date fields, 2 in one table and 3rd in 2nd table. How do I join all three to create a canonical date? I am able to do the dates in the same table, but fail with combining the third one. When I am trying to add the 3rd one , it will give a circular reference error because it is based on a different field.


This is my script:


Associate2AssociateBirthDate:

  Mapping Load Associate,AssociateBirthDateTime Resident [Associate];

Associate2AssociateReadTime:

  Mapping Load Associate,AssociateReadDateTime Resident [Associate];

Analyst2AnalystBirthDate:

  Mapping Load Analyst,AnalystBirthDateTime Resident [Analyst];


DateBridge:

Load Associate,ApplyMap('Associate2AssociateBirthDate',Associate,null()) as CanonicalDate

Resident [Associate];

Load Associate,ApplyMap('Associate2AssociateReadTime',Associate,null()) as CanonicalDate

Resident [Associate];

// Load Analyst,ApplyMap('Analyst2AnalystBirthDate',Analyst,null()) as CanonicalDate

// Resident [Associate];

The two tables are (1) Associate with fields Associate, AssociateBirthDateTime, AssociateReadDateTime

and (2) Analyst with AnalystBirthDateTime

The AnalystBirthDateTime is the one I am unable to put in the same CanonicalDate with the other two date fields.

1,166 Views
hic
Former Employee
Former Employee

How are the fields Associate and Analyst linked?

If they are linked through a fact table, e.g.

Image1.png

then you should perhaps use the TransactionID as key for the date bridge:

DateBridge:

Load TransactionID,

  ApplyMap('Associate2AssociateBirthDate',Associate,null()) as CanonicalDate,

  'AssociateBirthDate' as DateType

  Resident [Facts];

Load TransactionID,

  ApplyMap('Associate2AssociateReadTime',Associate,null()) as CanonicalDate,

  'AssociateReadTime' as DateType

  Resident [Facts];

Load TransactionID,

  ApplyMap('Analyst2AnalystBirthDate',Analyst,null()) as CanonicalDate,

  'AnalystBirthDate' as DateType

  Resident [Facts];

HIC

1,166 Views
Not applicable

hic, there isn't a table in between really. the 2 tables are linked directly. how do we proceed in this case?

qlik-2016-08-19_13-44-46.png

Thanks!

0 Likes
1,236 Views
hic
Former Employee
Former Employee

Does this mean that an Associate only can have one Analyst associated?

If so, you should use

DateBridge:

Load Associate,

  AssociateBirthDateTime as CanonicalDate,

  'AssociateBirthDate' as DateType

  Resident [Associate];

Load Associate,

  AssociateReadDateTime as CanonicalDate,

  'AssociateReadTime' as DateType

  Resident [Associate];

Load Associate,

  ApplyMap('Analyst2AnalystBirthDate',Analyst,null()) as CanonicalDate,

  'AnalystBirthDate' as DateType

  Resident [Associate];

1,236 Views