hic
Former Employee
Former Employee


A common situation when loading data into a Qlik document is that the data model contains several dates. For instance, in order data you often have one order date, one required date and one shipped date.


Base model.png


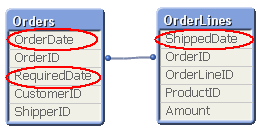
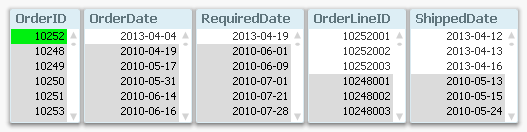
This means that one single order can have multiple dates; in my example one OrderDate, one RequiredDate and several ShippedDates - if the order is split into several shipments:


Logic 1.png


So, how would you link a master calendar to this?


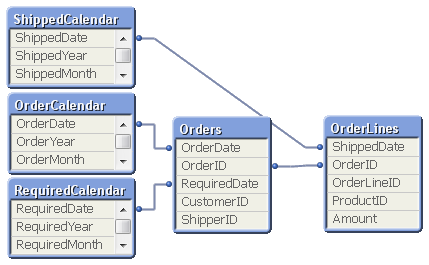
Well, the question is incorrectly posed. You should not use one single master calendar for this. You should use several. You should create three master calendars.


The reason is that the different dates are indeed different attributes, and you don’t want to treat them as the same date. By creating several master calendars, you will enable your users to make advanced selections like “orders placed in April but delivered in June”. See more on Why You sometimes should Load a Master Table several times.


Your data model will then look like this:


Model with spec calendars.png


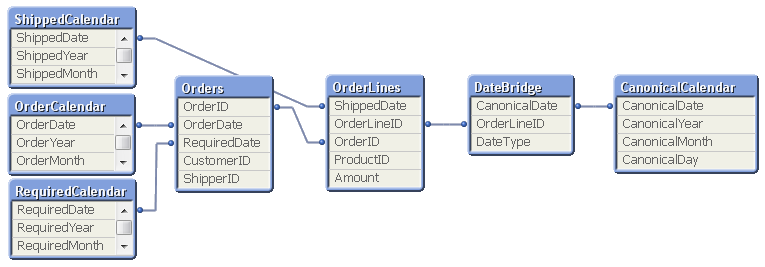
But several different master calendars will not solve all problems. You can for instance not plot ordered amount and shipped amount in the same graph using a common time axis. For this you need a date that can represent all three dates – you need a Canonical Date. This is how you create it:


First you must find a table with a grain fine enough; a table where each record only has one value of each date type associated. In my example this would be the OrderLines table, since a specific order line uniquely defines all three dates. Compare this with the Orders table, where a specific order uniquely defines OrderDate and RequiredDate, but still can have several values in ShippedDate. The Orders table does not have a grain fine enough.


This table should link to a new table – a Date bridge – that lists all possible dates for each key value, i.e. a specific OrderLineID has three different canonical dates associated with it. Finally, you create a master calendar for the canonical date field.


Full model.png


You may need to use ApplyMap() to create this table, e.g. using the following script:


     DateBridge:
     Load
          OrderLineID,
          Applymap('OrderID2OrderDate',OrderID,Null()) as CanonicalDate,
          'Order' as DateType
          Resident OrderLines;

     Load
          OrderLineID,
          Applymap('OrderID2RequiredDate',OrderID,Null()) as CanonicalDate,
          'Required' as DateType
          Resident OrderLines;

     Load
          OrderLineID,
          ShippedDate as CanonicalDate,
          'Shipped' as DateType
          Resident OrderLines;


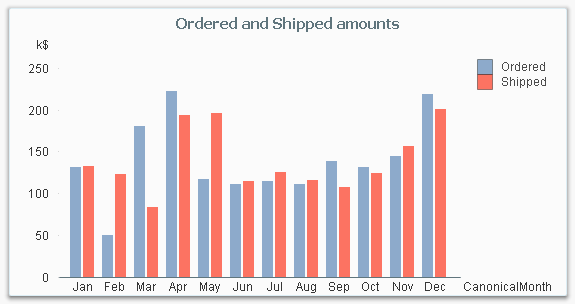
If you now want to make a chart comparing ordered and shipped amounts, all you need to do is to create it using a canonical calendar field as dimension, and two expressions that contain Set Analysis expressions:


     Sum( {$<DateType={'Order'}>} Amount )
     Sum( {$<DateType={'Shipped'}>} Amount )


Bar chart.png


The canonical calendar fields are excellent to use as dimensions in charts, but are somewhat confusing when used for selections. For this, the fields from the standard calendars are often better.


Summary:

  • Create a master calendar for each date. Use these for list boxes and selections.
  • Create a canonical date with a canonical calendar. Use these fields as dimension in charts.
  • Use the DateType field in a Set Expression in the charts.


A good alternative description of the same problem can be found here. Thank you, Rob, for inspiration and good discussions.


HIC

192 Comments
hic
Former Employee
Former Employee

...and if AssociateBirthDateTime is a timestamp, you should probably use

Date(Floor(AssociateBirthDateTime )) as AssociateBirthDate

instead. And the same for AssociateReadDateTime.

HIC

1,267 Views
Not applicable

i got there but a synthetic key is being created. why? and what is a synthetic key and what does it do here exactly? the data seems to be coming through "correctly" , but this is a small test data i setup...qlik-2016-08-19_14-57-07.png

1,267 Views
a_isakov
Contributor
Contributor

Thanks a lot!

0 Likes
1,267 Views
hic
Former Employee
Former Employee

The "Associate-1" is redundant and should be removed. Then the synthetic key will disappear too.

HIC

1,267 Views
Anonymous
Not applicable

Hello Henric

I have used the above example that you had pasted in the sample qvw file and created a canonical calendar to link to the Date Raised and Date Resolved fields in my extract as below. The sub routine for generating calendar is exactly the same pasted in your qvw file.

DateLink:
// TR Extract Date Raised
LOAD
[TR #]
,
DateRaised as Date // Fact Date
,'Created' as DateType // Fact Type
RESIDENT Resident_TR_Dump
;

// TR Extract Date Resolved

LOAD
[TR #]
,
DateResolved as Date
,'Resolved'
as DateType
RESIDENT Resident_TR_Dump
;

CALL CalendarFromField('Date', 'CommonCalendar', '');
CALL CalendarFromField('DateRaised', 'CreatedCalendar', 'Created ');
CALL CalendarFromField('DateResolved', 'ResolvedCalendar', 'Resolved ');

Besides the Created and Resolved tickets I need to calculate the Outstanding tickets.

Outstanding tickets are all tickets with Status ='Open'.

I have used the Weekstart for the X axis and use the following expression count(DISTINCT{<Status={'Open'},[Referred to CPS]={'Y'}>}[TR #]) . Essentially it needs to show all tickets that are having status ='Open' even if there is a resolved date for all successive weeks until the Status is changed to Closed as of date. so if a ticket has a Open status that was created in 2015 it needs to reflect in the weekstart of 13 Oct 2016.

Issue that I am facing is that ticket is reflected only in the week that it has been created and in the week that it has been resolved. It is not being considered in the missing weeks between nor in subsequent weeks till date. Will you be able to assist me or guide me in the right direction?Capture.JPG

0 Likes
1,175 Views
hic
Former Employee
Former Employee

You need to create reference dates for all dates between the creation date and the resolved date. See Creating Reference Dates for Intervals

It may be that you don't need the canonical date, but instead should use the table with reference dates only.

HIC

0 Likes
1,175 Views
robert99
Specialist III
Specialist III

"The canonical calendar fields are excellent to use as dimensions in charts, but are somewhat confusing when used for selections. For this, the fields from the standard calendars are often better."

I don't agree with this comment about selections. Has Henric had a change of heart on this (Feb 2014 post). Or does anyone else have any views on this?

I much prefer just having one calendar that can be used to make all selections particular using SENSE self service. I will now do everything I can to link all the date fields to one canonical calendar. Its so much easier for the users to understand. And as I set up all the expressions I just ensure they are correctly set up and labelled for the various dates. Like Rev£Invoiced and another one for Rev£Orders. With only one Calendar (Month, Year etc)

At times I have not been able to do a canonical date for all the required dates eg there is no suitable table with all the required attributes. Even then I have used a canonical date for the tables where I could. And then used a Date Island approach using the CanonicalDate. When needed I only create calendar fields for dimensions needed. I label then so it discourages users to use them for selections (eg MthXYZ.DontUseSelections and rename in the visualisation)

I've done this because of the number of times users just make a wrong date selection. I've done it myself when a hurry and curse and wonder why the figures make no sense.

Is my approach unwise or not? For me canonical dates are brilliant because unlike a date island approach they can be used for both selections and dimensions. They are harder to set up though and care is needed.

Thanks for any comments on this. I'm certainly not a Qlik script expert.   

0 Likes
1,175 Views
Anonymous
Not applicable

"Or does anyone else have any views on this?"

Here is a recent real life situation (simplified).

There are Orders with order date, estimated shipping date, and actual shipping date.  User wants three separate charts - number of orders by each of the above dates.

If use canonical date, when you select, for example, year 2015, you get 2015 on each chart - but it will be about different set of Orders.  An Order could be placed in 2014 and scheduled to ship in 2015.  And, shipped in 2016...  But users don't realize that, unless you announce it loudly.  And, when you do, they say, "No, no, I want the same Orders to be used in all three charts".  Hence, they needed three separate calendars.  So, if they select 2015 for Estimated Shipping date, they will see orders that were placed in 2014 or were shipped in 2016.

1,175 Views
hic
Former Employee
Former Employee

I probably have changed my mind on some issues, but in this question I think I have consistently spoken in favor of using multiple calendars for the selections.

If you use a canonical date as a general date selection, you will sooner or later end up in a situation where the user has selected a specific quarter/month/week but he will still see orders that were placed before his selection. E.g. He selects Oct 2016 but still sees orders placed in May 2016. The reason is of course that some orders weren't shipped until October.

This is a correct result given the data model, but it will be very confusing for a business user. This is why I advocate that the different dates should be displayed in different list boxes. Only then will it be obvious to the business user what goes on.

0 Likes
1,175 Views
Anonymous
Not applicable

Thanks and I did find the article useful. I still have few queries.

1) Please can you direct me to the master calendar script containing Referencedate as the Reference date from the Policies_x_Dates links to the Master Calendar. I wasn't able to find the Master Calendar script for it in the blog..

2) I have multiple tables that I am loading data.I had used the canonical calendar script since I had to depict opened vs resolved  from 4 tables on one time axis.each of these tables have different field names for Data Opened and Date Closed. It worked fine until Outstanding count was not expected

How do i then modify Referecedate script to include multiple Opened and Resolved dates from different tables on one X axis?

0 Likes
1,175 Views