Announcements
Qlik Connect 2024! Seize endless possibilities! LEARN MORE
hic
Former Employee
Former Employee


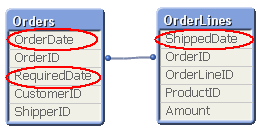
A common situation when loading data into a Qlik document is that the data model contains several dates. For instance, in order data you often have one order date, one required date and one shipped date.
 

Base model.png


This means that one single order can have multiple dates; in my example one OrderDate, one RequiredDate and several ShippedDates - if the order is split into several shipments:


Logic 1.png


So, how would you link a master calendar to this?


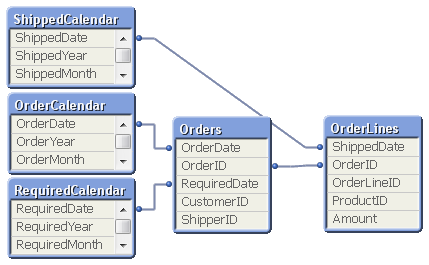
Well, the question is incorrectly posed. You should not use one single master calendar for this. You should use several. You should create three master calendars.


The reason is that the different dates are indeed different attributes, and you don’t want to treat them as the same date. By creating several master calendars, you will enable your users to make advanced selections like “orders placed in April but delivered in June”. See more on Why You sometimes should Load a Master Table several times.


Your data model will then look like this:
 

Model with spec calendars.png


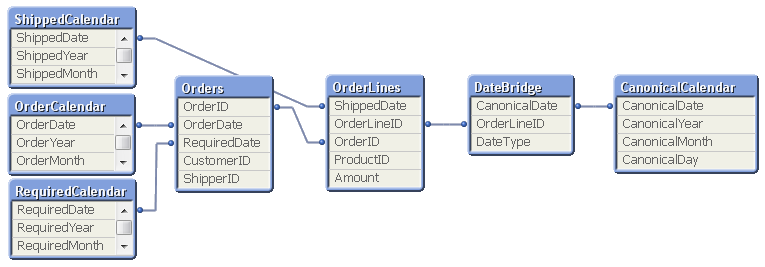
But several different master calendars will not solve all problems. You can for instance not plot ordered amount and shipped amount in the same graph using a common time axis. For this you need a date that can represent all three dates – you need a Canonical Date. This is how you create it:


First you must find a table with a grain fine enough; a table where each record only has one value of each date type associated. In my example this would be the OrderLines table, since a specific order line uniquely defines all three dates. Compare this with the Orders table, where a specific order uniquely defines OrderDate and RequiredDate, but still can have several values in ShippedDate. The Orders table does not have a grain fine enough.


This table should link to a new table – a Date bridge – that lists all possible dates for each key value, i.e. a specific OrderLineID has three different canonical dates associated with it. Finally, you create a master calendar for the canonical date field.
 

Full model.png


You may need to use ApplyMap() to create this table, e.g. using the following script:


     DateBridge:
     Load
          OrderLineID,
          Applymap('OrderID2OrderDate',OrderID,Null()) as CanonicalDate,
          'Order' as DateType
          Resident OrderLines;

     Load
          OrderLineID,
          Applymap('OrderID2RequiredDate',OrderID,Null()) as CanonicalDate,
          'Required' as DateType
          Resident OrderLines;

     Load
          OrderLineID,
          ShippedDate as CanonicalDate,
          'Shipped' as DateType
          Resident OrderLines;


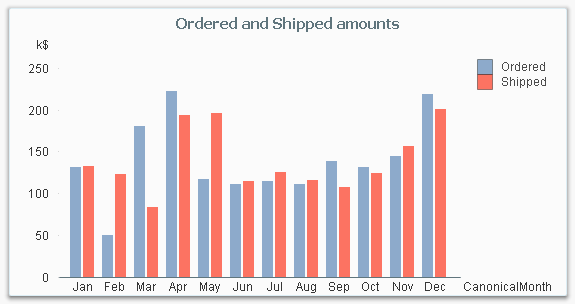
If you now want to make a chart comparing ordered and shipped amounts, all you need to do is to create it using a canonical calendar field as dimension, and two expressions that contain Set Analysis expressions:


     Sum( {$<DateType={'Order'}>} Amount )
     Sum( {$<DateType={'Shipped'}>} Amount )
 

Bar chart.png


The canonical calendar fields are excellent to use as dimensions in charts, but are somewhat confusing when used for selections. For this, the fields from the standard calendars are often better.


Summary:

  • Create a master calendar for each date. Use these for list boxes and selections.
  • Create a canonical date with a canonical calendar. Use these fields as dimension in charts.
  • Use the DateType field in a Set Expression in the charts.


A good alternative description of the same problem can be found here. Thank you, Rob, for inspiration and good discussions.


HIC

192 Comments
Anonymous
Not applicable

Thanks Henric..The same script worked..I dont know why it failed earlier when I posted my earlier response..I ran it again and worked when i turned on 'Show all values'

0 Likes
665 Views
Not applicable

Nice one Henric

0 Likes
665 Views
vadim_grab
Creator
Creator

Dear, Henric.

I  am looking for solution same problem. My data model has 3 tables: Facts, CustomerMonthlyPlans and MasterCalendar. MasterCalendar - The Fastest Dynamic Calendar Script (Ever) which generated on DateID Field (Facts Table)

Can you  show me on my example how I can linked Month in Calendar to see Customer Plan and Actual both.

Thanks a lot for any answer.

D_QlikView_test3.qvw 2017-01-05 18.31.28.png

0 Likes
665 Views
hic
Former Employee
Former Employee

You can use the three tables you already have, but you need to change the key between "Facts" and "CustomerMonthlyPlans". Use

   Customer_ID & '|' & MonthStart(DateID) as CustomerMonthID

instead.

In the Plan table, you must make sure that you get the same formatting of the date in the key, for example

   Customer_ID & '|' & MonthStart(PlanMonth) as CustomerMonthID

or

   Customer_ID & '|' & MakeDate(PlanYear, PlanMonth) as CustomerMonthID

depending on the format of PlanMonth.

HIC

0 Likes
665 Views
vadim_grab
Creator
Creator

Henric,

Many thanks for so fast answer. "Everything of genius is simple!"

But there is some problem -  MasterCalendar generated on Facts field Date (Date with  Actual). Some Customers who didn't have Actual at December 2016 don't have CustomerMonthID so some Customers Plans not displayed  (Some Customer has  a MonthPlan but don't linked with MasterCalendar Month).

What should I do in this case?

Many thanks for your answer.

0 Likes
670 Views
hic
Former Employee
Former Employee

There are a couple of different ways to solve this.

  1. Add dummy records to the Facts table: Give every customer an additional transaction of 0 every first of the month. Then the current data model will work fine. See Product not exists - add manual values zero or Generating Missing Data In QlikView
  2. Concatenate the actual numbers with the plan numbers into one single fact table. Use generic keys to solve the problem of different granularity in the different tables (the Actual numbers have dates, and the Plan numbers have months, and you want both to link to something relevant in the calendar). See Generic keys.

HIC

670 Views
vadim_grab
Creator
Creator

Henric,

Exactly what is needed!!! I prefer the second option.


Thanks a lot!


P.S. Please add me to your contacts network

0 Likes
670 Views
vadim_grab
Creator
Creator

Henric,

Table Facts include  DateID, Customer_ID and Actuals

Concatenate (Facts)  // Table CustomerPlans

LOAD

Floor(PlanMonth) As DateID ,   // PlanMonth has format DD.MM.YYYY (Dec = 01.12.2016)  AutoNumber(Customer_ID, 'Customer') as Customer_ID,

Num(Plan) As Plan


Working...

0 Likes
670 Views
Anonymous
Not applicable

Hello,

I don't understand why in that example you use OrderDate and RequiredDate in the ApplyMap instruction (and before in the LOAD MAP) but you don't do the same thing with ShippedDate.

I am facing the same situation and i don't know which dates i should load directly and which ones i should load by the ApplyMap Instruction.

Thank you

0 Likes
670 Views
robert99
Specialist III
Specialist III

"i don't know which dates i should load directly"

Example

If there are two dates. One in a call table (initial call) and one in a  FSR table (field service request) So there is only ever one row / entry for one call (Call table = SCCall). But there can be many FSRs for one call (FSR table = SCFSR). The Call table and FSR table are joined by the Call_Num.

So the 'Date bridge' must join to the FSR table (finer grain) not the call table

//link table for required dates

DateBridge:  // FSR table

Load

CallFSR_LINK,     // join to the FSR table. This = Call_Num & FSR_Num

VisitDate AS DateC,   // Canonical Date

'Visit' as DateType      // to use in set analysis

Resident SCFSR

;

DateBridge:   //call table

Concatenate (DateBridge)

Load

CallFSR_LINK,  // join to the FSR table

ApplyMap ('MAPCALLINDATE'    ,Call_Num    ,'NoDate') as DateC,  //canonical Date from SCCall

'Call' as DateType     // to use in set analysis

resident SCFSR ;

NB If all dates are in the same table then load direct

0 Likes
670 Views