hic
Former Employee
Former Employee

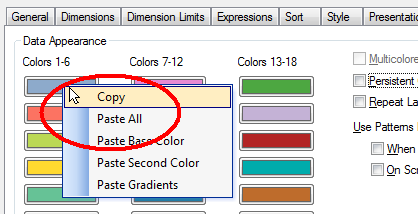
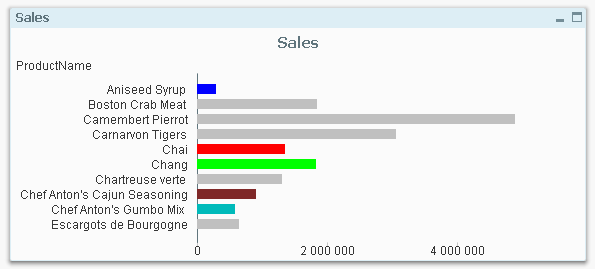
It is not uncommon that users want specific products or customers to be displayed in specific colors. The most obvious way to do this is to change the colors in the chart properties. This is in fact quite easy if you use the copy and paste functions found when you right-click a color button. Just copy one button and paste on another, and you have moved the color.


Copy and Paste.png


This way you can assign which color is to be used for the different values of the field. However, a prerequisite for this to work is that the order of the field values doesn’t change.


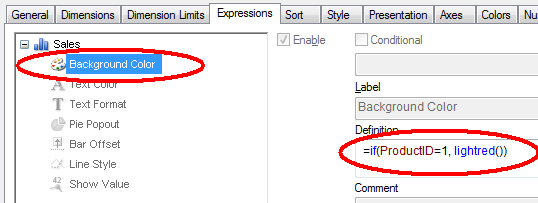
A more robust way is to use color functions. Usually, you want to set the color of a bar, line or bubble and this is done by using the “Background Color” on the Expression tab:


Color expression.png


By the way – don’t use Visual cues. This feature is old and not very versatile. Use color functions as described here instead.


In the picture above, both the product ID and the color are hard-coded in the expression. However, if you want to define colors for many products, the if-function will not be manageable. Then it is better to store this information in a table – either in the database or in an Excel sheet or as an inline statement in a scriptlet that is included in the script. Hence,


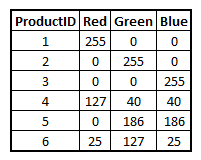
  1. Create your color definition table and store it in an appropriate place. The Red, Green and Blue columns hold the different color components and define the color uniquely.

    Color table.png
  2. Load the color definitions into a mapping table:
       ProductColors:
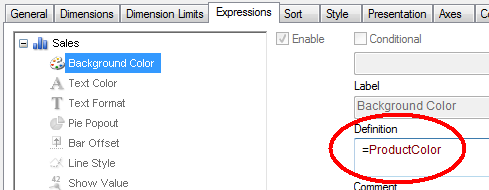
       Mapping Load ProductID, Rgb(Red,Green,Blue) as ProductColor From ProductColors

  3. Use this mapping table when loading the products table, creating a new field for the product color:
       Applymap('ProductColors', ProductID , LightGray()) as ProductColor
    The third parameter, here lightgray(), defines which color the unlisted products should get. If you instead use null(), the unlisted products will be multicolored according to the color settings in the chart properties.

  4. Finally, use this field as product color in the charts:

    Color expression2.png


This way it is easy to define which color specific products, customers, or other dimensions should get.


Which colors to use? Oh, that is a completely different topic:


HIC


Bar chart.png

34 Comments
Or
MVP
MVP

Thanks, Henric - as always, a good tip (I hadn't thought to use a mapping load with a built-in RGB function), and this approach is more efficient than what I've been using.

One thing to add. This should go without saying, but it often doesn't, so I'll just tack it on here -  before adding colors to a chart, customized or otherwise - stop and think whether these colors actually indicate anything, or just visual clutter.

If I may tap into Henric's example - perhaps this set of colors is meaningful to someone, but to the untrained eye, there's something wrong with Chai sales, whereas Chang sales are positively noteworthy (red and green, respectively). Generally speaking, it is best to avoid colors in a chart that contains a single dimension and a single expression, unless these colors are used to indicate a second expression (e.g. shades of red/green or red/blue to indicate margin% in a graph where the bars indicate total sales). Our eyes are naturally drawn to color changes, and if these color changes don't actually mean anything, all we're doing is drawing attention away from the real information presented in the chart.

9,956 Views
hic
Former Employee
Former Employee

I totally agree that colors should be used to carry information - it should not be used as decoration only.

However, I find it useful to use the same color for the same product/region/project over time and in different charts. It helps the user to get an overview and find the interesting dimensional values. The user learns that e.g. a specific region always is green. This works fine when you have just a few dimensional values that you want to track. I realize that this contradicts your statement of avoiding colors in a single dimension, but I still claim that colors can be useful also in a single dimension when you want to track a few (<6 ?) dimensional values.

To me, the important point is that colors should carry information.

HIC

9,956 Views
Or
MVP
MVP

An interesting question. As always, there's probably no one correct answer.

If used in a series of charts on the same screen, I can see the value of having dimensions color-coded between charts. It does help in locating the correct one and comparing values across charts. Another context where color-coding can be useful in a single dimension is if you're comparing something that actually has colors (e.g. sales of phones/tablets, color-coded by the actual color of the product). This can sometimes help locate trends that you might otherwise miss - but it is still probably inferior to simply charting out sales by color as a dimension.

I'm not sure I can get behind the idea of using arbitrary colors to encode regions (or similar values which lack inherent color encoding) unless it's in charts that are visible at the same time, on the same page - I think that by forcing a user to tap into long-term memory ("Wait, green is Americas, and blue is.. uh, West Europe?") to use the encoded values, you modify the way a chart is perceived in a manner that isn't necessarily desirable. 

In any case, I think we agree on the key point here - colors should be used to convey relevant information, rather than for decoration or irrelevant/spurious information (as in the example of using red and green colors, which could easily be confused for good/bad).

0 Likes
9,956 Views
hic
Former Employee
Former Employee

I think all your considerations are relevant and correct. My view is that it is with this as with everything else: It's a trade-off. There are pros and cons with everything. If we optimize the application for the untrained eye, we will choose some solutions. But if we instead optimize for a user with a trained eye, a user that has used the application every week for the last year, then we do it in a different way.

In most cases I do not mark the individual products with colors as described in the blog post. But in some cases I do - when it adds informational value to the application.

Finally, I used bright red and bright green in the pictures, just so that it would be possible to see them in the color definition table also. I would not do that in real life. I would use softer colors (lower saturation). Also, red is a color that generally should be avoided - unless it carries information as a warning.

The three links in the end of the post contains much wisdom about which colors to choose.

HIC

0 Likes
9,956 Views
pablolabbe
Luminary Alumni
Luminary Alumni

Once again a great tip.

I suggest an article to create heat maps based on color gradients. I tried to use the colormix wizard but find the expressions too complex when applying thresholds.

Best regards,

Pablo

0 Likes
9,956 Views
Not applicable

Pablo Labbe escribió:


Once again a great tip.

I suggest an article to create heat maps based on color gradients. I tried to use the colormix wizard but find the expressions too complex when applying thresholds.

Best regards,

Pablo


Maybe this blog can give you ideas for the heatmaps and other nice features

http://qvdesign.wordpress.com/2012/01/18/activity-ribbon-chart/

0 Likes
9,956 Views
Not applicable

Me parece muy buana nota.

Estuve viendo el manual de la version 11 y en las propiedades de un gráfico, colores, tengo la opción de Segmentos Especiales. De ahi parece que se le puede asignar un color a la porción de "otros".

En la version 10 solo encontré como cambiar el nombre a la etiqueta de "Otros" pero mi necesidad es asignarle un color especifico.

Me podrian dar una mano, soy nuevo en el tema. Muchas gracias

0 Likes
7,875 Views
Miguel_Angel_Baeyens

Hola Leandro,

Henric propone que uses el siguiente código el la expresión de color para la dimensión:

=If(Count(distinct Dim)=1, Only(DimColor), Black())

Donde Dim es el campo de dimension, DimColor es la función RGB que contiene el color y Black() la función del sistema que devuelve el color negro.

Espero que te sirva.

Miguel

0 Likes
7,875 Views
Not applicable

Hello

somehow this is not working for me. I have a long Excel file with all contacts and coordinates which i would like to display on google maps. This works- but i would like to have the dots on different colors depending on the business segment (=industry).

Industry Red Green Blue
Aerospace and Defense 127127127
Automotive 1633232
Chemicals and Materials 12740

40

and so on....

I created this color definition table in excel as shown above and i am loading it like this:

Mapping LOAD Industry, RGB(Red,Green,Blue)as ProductColor from [path...data.xlsx]
(
ooxml, embedded labels, table is color);

The problem is that i can not assign ProductColor to the background color. QlikView says: Bad field name: ProductColor

Why is it not recognised?

cheers

Jay

0 Likes
7,875 Views
hic
Former Employee
Former Employee

The Mapping Load only creates a mapping table. To create the field, you need to define the field in a normal Load, which I do using ApplyMap.

HIC

0 Likes
7,875 Views