Unlock a world of possibilities! Login now and discover the exclusive benefits awaiting you.
- Qlik Community
- :
- Discover
- :
- Blogs
- :
- Product
- :
- Design
- :
- Conditional Aggregations
- Subscribe to RSS Feed
- Mark as New
- Mark as Read
- Bookmark
- Subscribe
- Printer Friendly Page
- Report Inappropriate Content
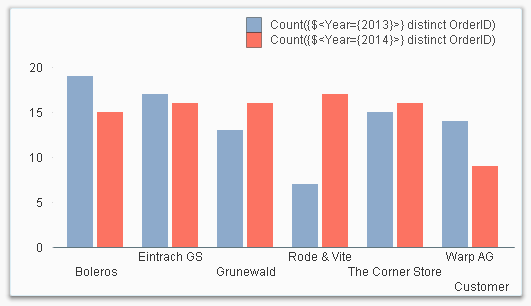
Often you need to create conditional aggregations in QlikView, e.g. when you want to create a graph that shows this year’s numbers only, also if there are several years possible.
There are basically three ways to do this
- A conditional expression outside the aggregation function, e.g. If(<Condition>, Sum(<Expression>))
- A conditional expression inside the aggregation function, e.g. Sum(If(<Condition>,<Expression>))
- Set Analysis, e.g. Sum( {<Set Expression>} <Expression> )
If you choose a conditional expression outside the aggregation function, you will have a condition that is evaluated once per dimensional value. Further, all three parameters of the If() function are aggregations, so you need to use aggregation functions, also in the condition, otherwise the expression will not be evaluated the way you want to.
So - don’t use naked field references!
If( ShippingDate >= vReferenceDate, Sum( Amount ) ) // Incorrect !
If( Min( ShippingDate ) >= vReferenceDate, Sum( Amount ) ) // Correct
If you instead put the conditional expression inside the aggregation function, you will have a very different situation: First, the condition will be evaluated on the record level of the source data. In other words: You may get performance problems if you have large data amounts.
Sum( If( ShippingDate >= vReferenceDate, Amount ) )
Secondly, the aggregation function now contains an expression based on several fields (in the above example, ShippingDate and Amount), possibly from several source tables. This means that QlikView will aggregate over the Cartesian product of the included source tables. Normally this is not a problem, but in some odd cases, you will have results different from what you expect.
For instance, if the record with Amount has several shipping dates associated with it, the amount will be counted several times, once per shipping date, and you will get a result that you probably consider incorrect. There is usually a way to get around this problem by writing the expression differently, but if you can’t find one, you should use Set Analysis instead.
The conditional expression can be written in several ways:
- String comparison: If( Field = ‘string’, Amount )
- Numeric comparison: If( Field = number, Amount )
- Boolean condition: If( Flag, Amount ) e.g. Sum( If( IsThisYear, Amount ) )
- Multiplication: Flag * Amount e.g. Sum( IsThisYear * Amount )
The two first examples contain comparisons, whereas the two last contain flags - Boolean fields created in the script. All four ways work fine, but I would recommend avoiding comparisons altogether. Use flags instead. See e.g. Year-over-Year Comparisons for more on flags.
Finally, you can choose to use Set Analysis. This is slightly different from other conditional expressions in that it uses the QlikView selection metaphor for the analysis: First, the Set Expression is interpreted as a selection, whereupon the aggregation is evaluated given this selection.
Sum( {$<ShippingDate = {">='$(vReferenceDate)'"}>} Amount )
Sum( {$<IsThisYear = {1}>} Amount )
This means that Set Analysis often is faster than using a conditional expression inside the aggregation. It also means that it calculates what you expect, as opposed to a case where an inside condition creates an unwanted Cartesian product.
However, a drawback with the Set Analysis is that it needs to be performed before QlikView performs the aggregation – you cannot have a Set Expression that evaluates to different values for different rows. The work-around is to calculate the condition in the script and store it in a flag.
Bottom line: Define flags in the script. And use Set Analysis.
Further reading related to this topic:
You must be a registered user to add a comment. If you've already registered, sign in. Otherwise, register and sign in.