hic
Former Employee
Former Employee

Last week I wrote about how to create reference dates for exchange rates and warehouse balances: How to populate a sparsely populated field.


There is however also a second case where you want to create reference dates, but the data model is quite different. It is when you have a list of contracts with validity periods: Rental contracts, Insurances policies, Healthcare commitments, etc.


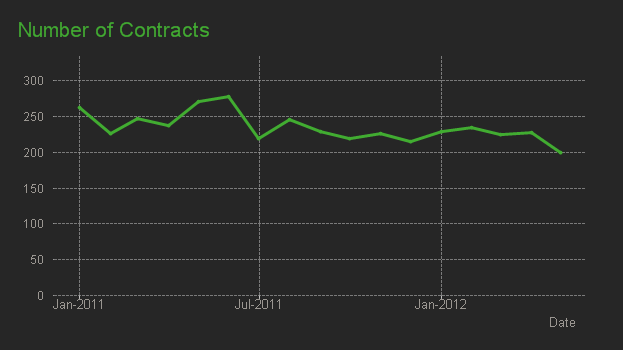
Each contract has a begin day and an end day. The analysts of an insurance company would probably want to ask the question: “How many valid insurance policies did we have on this specific day?” In other words, he wants to click on a reference date to see the count of policies that are associated with this date – even though this date doesn't exist in the source data.


The solution is to first load all policies in one table. Then load a second table that has one record per policy and date (Policies_x_Dates). This second table can in turn link to a master calendar.


Data Model.png


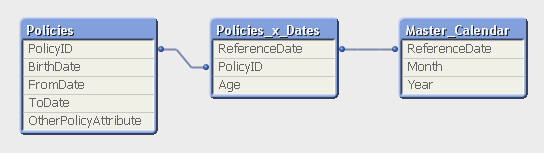
But the middle table does not exist in the source database. Instead, you must generate it using a While loop that loops over each record in the Policies table, i.e. each source record will be loaded several times. This way, you can load not only the “From” date and the “To” date, but also all dates in between:


Policies:
Load PolicyID, BirthDate, PolicyAmount, FromDate, ToDate, OtherPolicyAttribute
          From Policies;


Policies_x_Dates:

Load PolicyID,
          Age( FromDate + IterNo() – 1, BirthDate ) as Age,
          PolicyAmount / (ToDate - FromDate + 1) as DailyAmount,
          Date( FromDate + IterNo() – 1 ) as ReferenceDate
          Resident Policies
          While IterNo() <= ToDate - FromDate + 1 ;


Note that the Policies table has exactly one record per insurance policy, and the newly created Policies_x_Dates table has exactly one record per combination of policy and date. Note also that there are other fields that should be put in the Policies_x_Dates table, e.g., the age of the insured person, since this depends on the reference date. Further, it is possible to break up a cost or an income into daily amounts, which is useful when you want to show the correct amount distributed over the year.


Amount over time.png


The While loop is a very useful tool whenever you need to create additional tables in the data model. It is often a better option than the IntervalMatch.


Read more in Generating Missing Data In QlikView.


HIC

47 Comments
rajeshvaswani77
Specialist III
Specialist III

Thanks Henric, this is an interesting blog.

0 Likes
8,219 Views
Anonymous
Not applicable

Thanks Henric:

I follow every one of your post & documents.

I made some kind of Knowledge Base with them

by the way ...

hic

Why did you change your last name ?

CB

0 Likes
8,219 Views
hic
Former Employee
Former Employee

No, the name hasn't changed. It's still Cronström. Just some software problems since we upgraded the software on which QlikCommunity is running...

HIC

0 Likes
7,111 Views
peschu123
Partner - Creator III

Thanks Henric for your great continous work .

UTF-8 for the win!

0 Likes
7,111 Views
wizardo
Creator III
Creator III

Hi,

I loved that post, in qlikview many times similar things can be done id different and varied ways.

Its always nice to meet an approach that shades the light from a different   point/angle/height/perspective.

It gives one hope that when he stumbles upon difficulties in his own way, someone can come along and shade the light on something not seen before:)

hope which i admit i posses.

In my case i have a data model that contains 5 main Fact tables that in turn contain many of those pairs of dates.

E.G. creation and deletion date, offered and converted date, etc etc.

Lets say about 5-6 pairs per main table. and each pair may be related to a different attribute.

In light of your post what would be your recommendation in dealing with this situation?

Creating a big combination date-attribute  table in between the main calendar and my link-table?

Using your method? or intervalMatch.

Thanks again anyways for a great post (one of many, many of yours)

Daniel

0 Likes
7,111 Views
gerhard_jakubec
Contributor III
Contributor III

Hi Henric,

thanks for this very straight forward post. If i got it right i'd say in your example the Policies_x_Dates table would be your fact table (although it's derived from Policies dimension) whereas Policies and Master_Calendar make up your dimensions. However this approach increases data amount by ("# of policies" * "days ot policy duration") so i try to work out an alternative approach to exactly this requirement based on only two fact rows per policy (to reduce data volumy by "days of duration" - 2). Your main fact table would then hold only two records for each single policy.

ReferenceDate, PolicyID, xType

01.01.2000, 1, 'From Date'

31.12.2009, 1, 'To Date'

However i am afraid this concept leads to much more complex scripts and bad performance since almost all KPIs (e.g. Age) can not be stored inside the fact table any more and will have to be calculated on the fly. What do you think about it?

p.s.: also you have to use count( distinct PolicyID) to get the total number of policies correct?

0 Likes
7,111 Views
hic
Former Employee
Former Employee

You are right that it increases the data amount, but I don't see any way around it. The alternative is - just as you have noticed - that you need to calculate complex things on the fly and create a "kludgy" solution.

No, the best solution is to use a Policies_x_Dates table. And using a Count(distinct PolicyID) is not a problem. See http://community.qlik.com/blogs/qlikviewdesignblog/2013/10/22/a-myth-about-countdistinct

HIC

0 Likes
7,111 Views
upaliwije
Creator II
Creator II

Hi Henric

Please elaborate me how a P&L statement could be prepared using your above method insted of interval match

0 Likes
7,111 Views
Not applicable

HIC, such a great tipp

Thx for sharing.

Grüße aus Düsseldorf 🙂

/olli

0 Likes
7,028 Views
Not applicable

Hi Henric,

This post is very very excellent !!

My question is : What should we do if we have more than two date ?

For example. Suppose a business which treat claims.

So, In their Excel File we have

    Claim ID

    Arriving Date of Claim in the business

    Arriving Date of Claim in the Claim Service

    Treatment Date of the Claim

    Customer ID who sent Claim

    Sending Date of the Claim to the customer

    Empoyee who treated the claim

The analyst want to be able to select a date and see many KPI calculated from differents date.

How to do it Please ?

0 Likes
7,028 Views