Unlock a world of possibilities! Login now and discover the exclusive benefits awaiting you.
- Qlik Community
- :
- Discover
- :
- Blogs
- :
- Product
- :
- Design
- :
- Creating a webpage based on the Qlik Sense Desktop...
- Subscribe to RSS Feed
- Mark as New
- Mark as Read
- Bookmark
- Subscribe
- Printer Friendly Page
- Report Inappropriate Content
Required: Qlik Sense Desktop, Helpdesk Management.qvf
Files Created: Index.html, index.js
Ok, we created a beautiful visualization that everyone in the company is excited about. One day we are asked to publish this onto our website and we are thinking… is this possible? Yes it is! Qlik Sense comes with a built in API that we can get any object that we have created in our app and put it on our website. In this article I will give you step by step directions on how to do that.
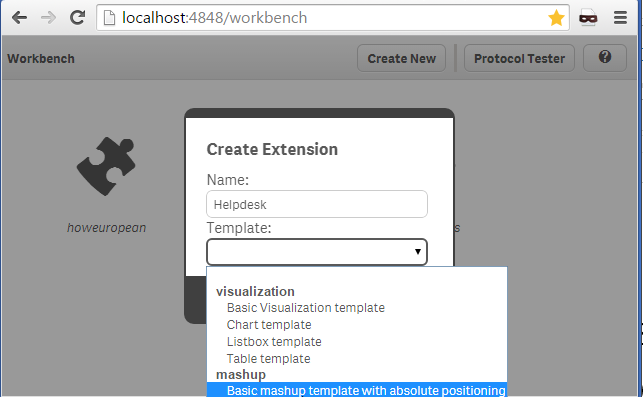
- Make sure that you have your Qlik Sense Desktop open. This will start a local server on port 4848 that you will be able to access your apps from. Name your App "Helpdesk" and from the template drop down select "Basic Mashup ..." and hit "Create"
- Now we need to enter into the app, so click on "Helpdesk" that was just created and from the popup window click on "Edit".
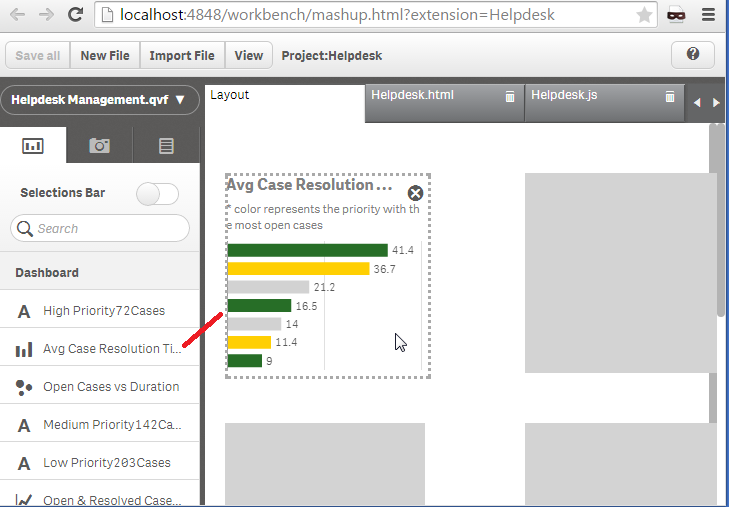
- There are 4 panels. The far left is where we choose our app and the objects that we will use in our webpage. On the right you will see the "Layout" tab. This is the place the we will drag our objects to and the 2 pages that automatically are created for us, "Helpdesk.html" and "Helpdesk.js". The workbench will create the basic code for us to get the objects from the Qlik Sense Desktop and html that will display these objects.
- Now, lets select our app from the left. Click on "Please choose an app" and select the "Helpdesk Management.qvf". All of the objects will be displayed for us to use. Lets select one bar graph to use in our webpage. Click on "Avg Case Resolution Time (Days)" and drag it to the "Layout" panel, onto the first grayed rectangle.
If you click on the "Helpdesk.html", you will see the included libraries. The css is needed for proper visualization and require.js to connect to the Qlik Sense Desktop and get the app.
our js file<link rel="stylesheet" href="https://community.qlik.com/resources/autogenerated/qlikui.css">
<link rel="stylesheet" href="https://community.qlik.com/resources/assets/client/client.css" media="all">
<script src="/resources/assets/external/requirejs/require.js"></script><script src="Helpdesk.js"></script>
and our placeholder for our objects<div id="QV01" style="position: absolute; top: 50px; left: 20px; width: 200px; height: 200px;" class="qvobject"></div>
- Now, moving on to the JavaScript file generated. This is composed of two parts. The fist, is the configuration.
var config = {
  host: window.location.hostname,
  prefix: "/",
  port: window.location.port,
  isSecure: window.location.protocol === "https:"
};
require.config( {
  baseUrl: ( config.isSecure ? "https://" : "http://" ) + config.host + (config.port ? ":" + config.port: "") + config.prefix + "resources"
} ); - and then we have the actual connection code where we get the app and the specific object.
require( ["js/qlik"], function ( qlik ) {The getObject method gets the specified object and displays it in the div with id="QV01"
var app = qlik.openApp('Helpdesk Management.qvf', config);
app.getObject('QV01','a5e0f12c-38f5-4da9-8f3f-0e4566b28398');
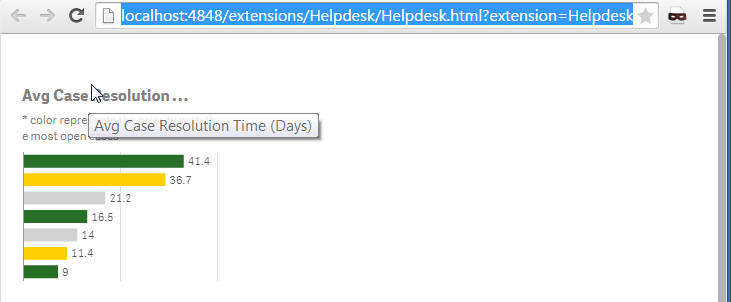
} );<div id="QV01" style="position: absolute; top: 50px; left: 20px; width: 200px; height: 200px;" class="qvobject"></div - That's it! We created our first Mashup. Make sure to click on "Save All" and preview by clicking on the "View" button.
- The files are located under:
C:\Users\<username>\Documents\Qlik\Sense\Extensions\Helpdesk
I hope this was helpful enough to get you started with displaying your visualizations on a webpage. If you have this app published on your QMC, change in the JavaScript the host (step#6) of your server and the id of the app (step#7) to something like
var app = qlik.openApp('bb4a797c-b483-462b-84d4-53238ce1eeb1', config);
---
More Info regarding the Qlik Desktop Workbench
You must be a registered user to add a comment. If you've already registered, sign in. Otherwise, register and sign in.