Jennell_McIntire
Employee
Employee

A couple of years ago I wrote a blog on customizing straight tables in QlikView explaining how you can add an ad-hoc report to your QlikView app.  So, I thought I would share how you can now create a custom report in Qlik Sense using the Climber Custom Report extension.  The Climber Custom Report is an extension that can be added to your Qlik Sense app to give users the ability to create their own ad-hoc reports.  In this blog, I will show you how easy it is to add a custom report to your app using Qlik Sense Desktop.

  1. The first step is to download the Climber Custom Report extension from Qlik Branch, unzip it and put it in your Extensions folder (C:\Users\xxx\Documents\Qlik\Sense\Extensions).
  2. In your Qlik Sense app, create a table with all the possible dimensions and measures a user may want to see in a report and then add the table to master items.  The table may look something like this: table.png
  3. Add the Climber Custom Report extension to a sheet in your app and then you are ready to create a report.
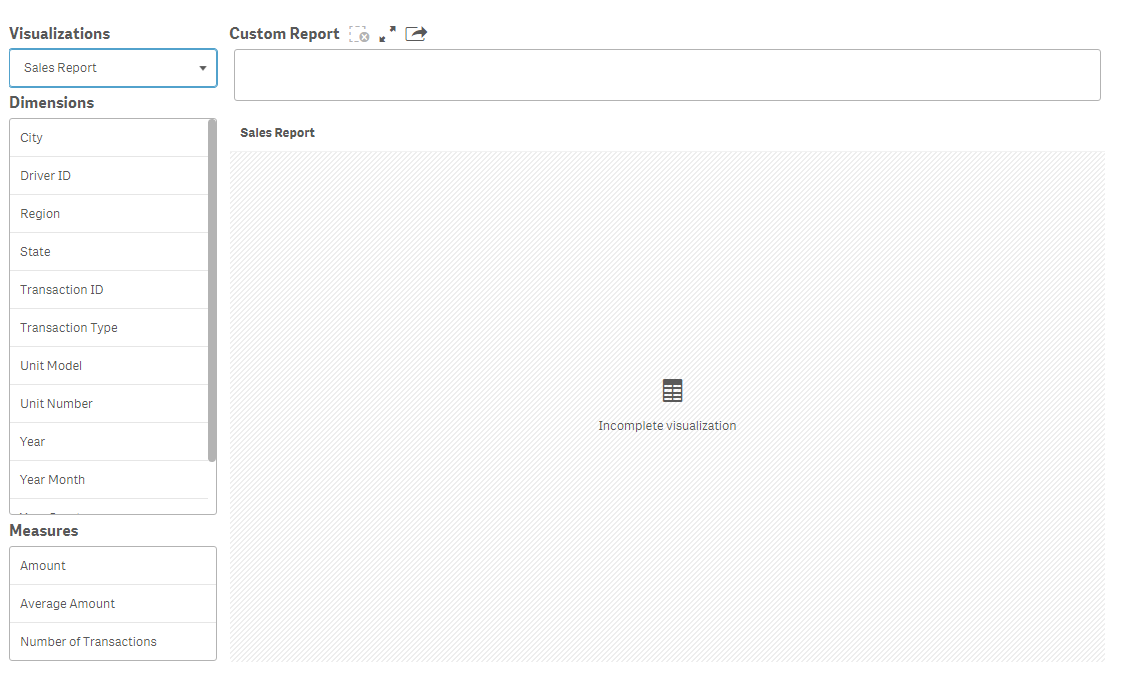
  4. In the Visualizations drop down, select the report you just created.  All tables that are in your visualization master items will be listed in the drop down.  Once the table is selected, the dimension and measure lists will be populated with the dimensions and measures that are used in the table as seen below.dimensions and measures.png
  5. Select the dimensions and measures you would like to add to your report by clicking on them.  Your report will look something like the image below after you make some selections.  The dimensions are blue and the measures are orange.selections.png
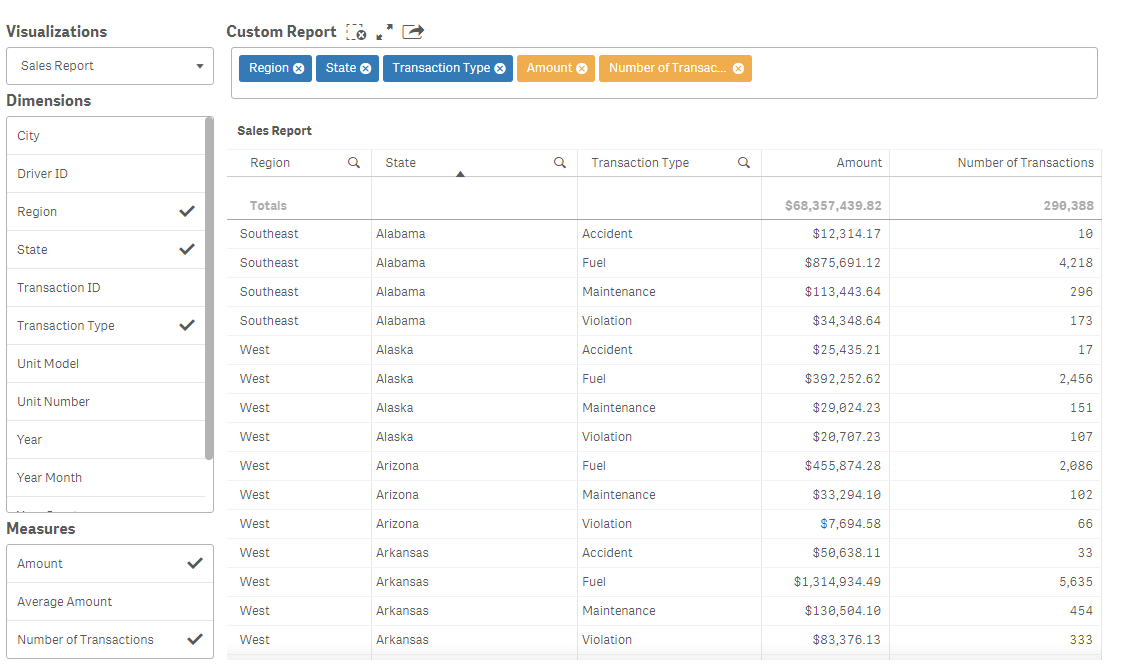
  6. From the custom report bar above the chart, you can remove a dimension or measure by clicking the x and you can change the order of the columns by dragging and dropping the dimensions and measures into the order you would like them to appear in the report.

And that is it - it is that simple to add a custom report to your Qlik Sense app.  With Qlik Sense self-service, a user can create a report by dragging and dropping dimensions and measures into a table but what I like about the Climber Custom Report extension is it makes everything available to the user with a clean, professional and organized look.  Download it now and test it out for yourself.  See the extension in action in the Situational Awareness demo.  Note - the Climber Custom Report extension works in Qlik Sense 3.0 and higher and, like all extensions, are not supported by Qlik.

Thanks,

Jennell

39 Comments
rodrigue_saade
Partner - Creator
Partner - Creator

Hi,

Is there any vision to make the same concept on Pivot Tables, similarly to straigh tables?

0 Likes
4,371 Views
Anonymous
Not applicable

Hi Rodrigue,

yes, we are working on that but no release date set yet.

0 Likes
4,371 Views
paulyeo11
Master
Master

Hi Michael

By the way look like all climber extension is develop by a team of developer.

Hope one day all climber extension can add as QS standard feature

So that on cloud it will be able support , and we are able to view the custom report on the cloud.

Paul Yeo

DIrector

TDS Technology (S) P/L

Whatsapp +65 9326 1804

www.tdstech.com<http://www.tdstech.com>

0 Likes
4,336 Views
Anonymous
Not applicable

Yes, all our extensions are developed by a team internally at Climber focused on extensions. All developers also work with creating customer solutions in Qlik Sense to make sure the extensions are built in a way that is closely connected to actual business needs and don't become to "technical" to use.

Personally I think it is unlikely that Qlik will choose to include the extensions in the core product. However Qlik have indicated that extensions will be supported also in Cloud so that should not be a problem going forward.

0 Likes
4,336 Views
paulyeo11
Master
Master

Hi Michael

Since climber have a team of developer , and it have been develop very good extension , does it mean that one day many user totally rely on the climber extension , will one day climber charge customer for using the extension ?

Paul Yeo

DIrector

TDS Technology (S) P/L

Whatsapp +65 9326 1804

www.tdstech.com<http://www.tdstech.com>

0 Likes
4,336 Views
paulyeo11
Master
Master

Hi Michael

After you have finish the pivot table can you create on that support chart ?

Paul Yeo

DIrector

TDS Technology (S) P/L

Whatsapp +65 9326 1804

www.tdstech.com<http://www.tdstech.com>

0 Likes
4,336 Views
Not applicable

‌hi all,

Does someone know when the climber extensions will be supported in the qlik cloud?

REgards,

John Wiegersma

0 Likes
4,336 Views
paulyeo11
Master
Master

Very good question. I am also hope that Qlik will try to make it . This will help a lot.

Paul Yeo

DIrector

TDS Technology (S) P/L

Whatsapp +65 9326 1804

www.tdstech.com<http://www.tdstech.com>

0 Likes
4,336 Views
Anonymous
Not applicable

I generally really like this extension.

However, when I use a variable which calculates a percentage, and look at the totals row, it seems like the table calculates the mean just like my percentages were absolute numbers (summing them and dividing by number of rows). This obviously gives a misleasing total.

Qliks own straight table calculates the totals of percentages correct when I use the same dimensions, measures ect..

Is this a general problem for this extension or am I possibly doing something wrong?

0 Likes
4,425 Views
Anonymous
Not applicable

How to display the count of rows displayed in the grid. Stuck here. JQuery only returns the row count whatever is displayed on screen not the actual count of grid contains the data.

0 Likes
4,425 Views