Jennell_McIntire
Employee
Employee

In many of the demos that I have done, I have added a customizable straight table or ad-hoc report where the user can select the dimensions and measures that should appear in the chart.  This is often helpful and can replace multiple detailed straight tables in an application.  Creating the customizable chart involves simply loading the dimensions and measures that the users can pick from and then adding a straight table with conditional dimensions and expressions.


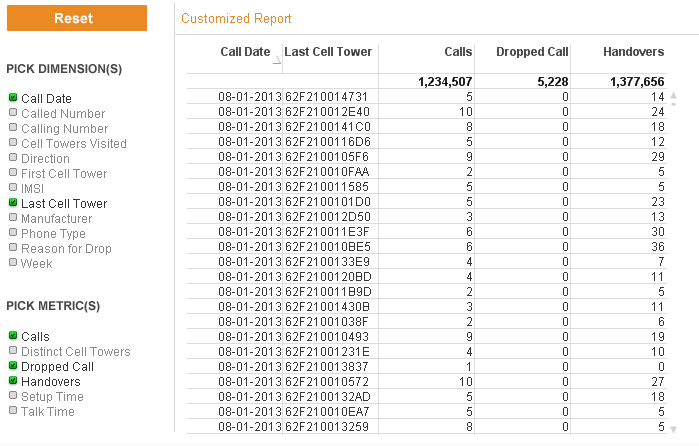
In the Call Detail Record Analysis demo a customized report was added to the application.  This is how the ad-hoc report looks with some dimensions and metrics selected.
 

report.png


The steps taken to build this report were:


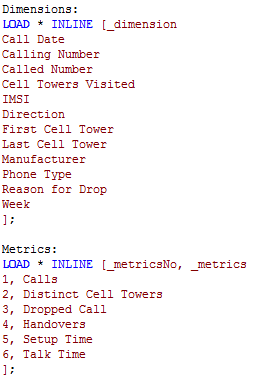
  • Load dimensions and metrics that should appear in the list box for the user to choose from.  In this example, this was done by adding two inline tables with the script below.
 

inline tables.png


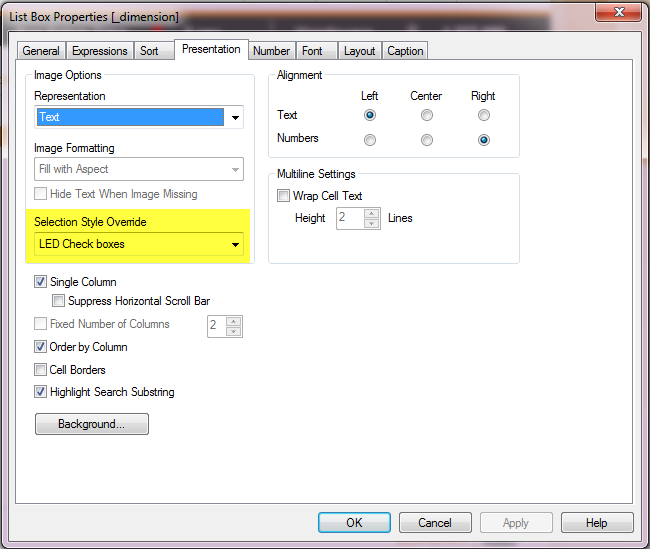
  • Then list boxes for _dimension and _metrics were added to the report sheet with the LED Check boxes selection style.
 

     led style.png


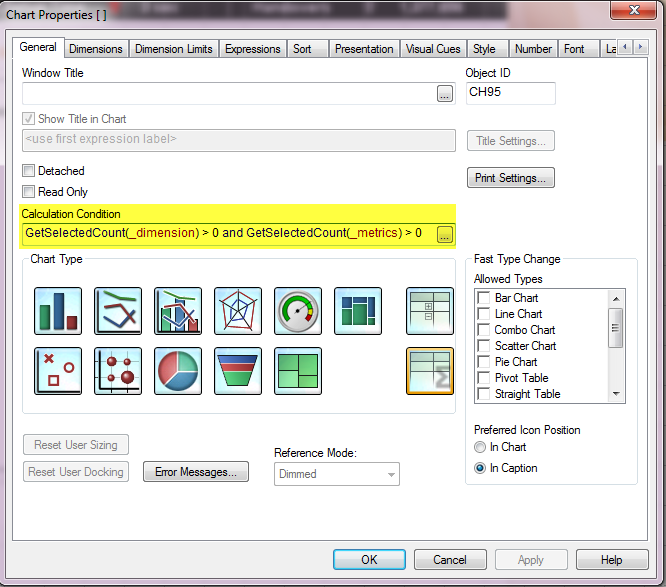
  • Next a straight table is added to the sheet with the following conditional calculation:
 

     calc condition.png

        The chart will be displayed if at least 1 dimension and 1 metric are selected from the list boxes.


  • Next the dimensions were added to the table.  Each dimension in the list box was added to the chart with a conditional expression so that the dimension is only displayed if it is selected from the Dimensions list box.
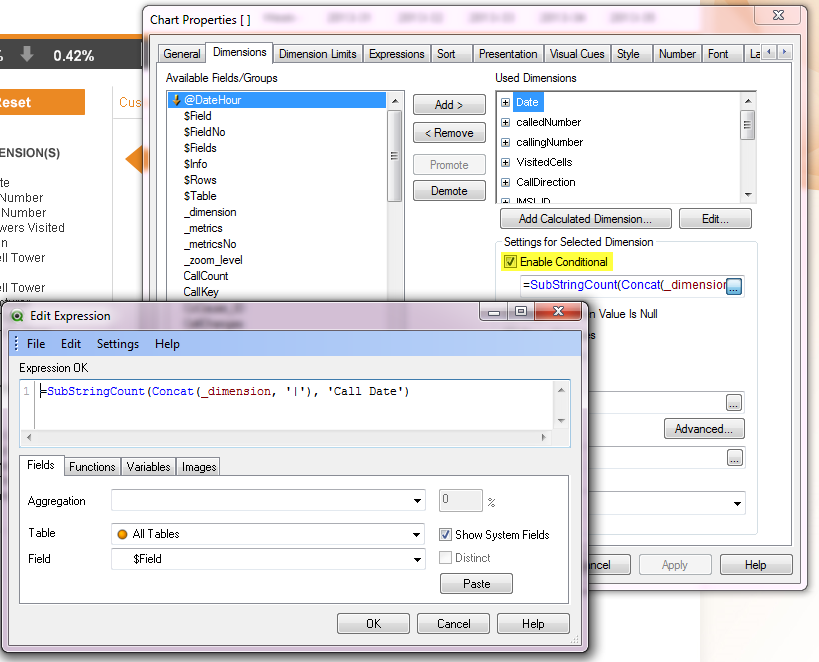
     dimensions.png


  • The same was done for each measure listed.
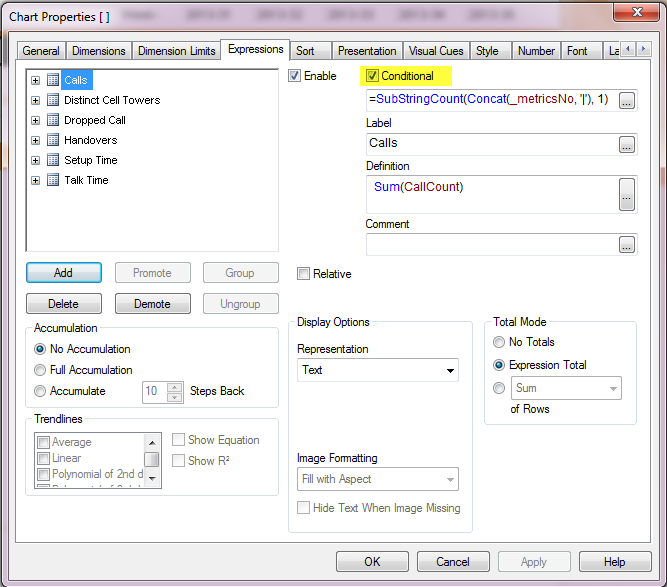
 

     expressions.png


In five easy steps, a customizable straight table or report can be added to your QlikView application providing users the ability to display a report with the data they want to see at the time.  This gives the user more flexibility and reduced the need to add detailed straight table charts to the sheets in the application.


You can read more about this topic in my Technical Brief which has more detailed step-by-step instructions.  Have fun!


Thanks,

JMC

75 Comments
Anonymous
Not applicable

QlikView How To (or Tips & Tricks) Application

You can find a working example done slightly different in the Quick Report section of the file attached to the above article.

0 Likes
8,032 Views
neilhepburn
Partner - Contributor III

Further to my last e-mail (and in response to other commentators)  I have created a simple QlikView document which illustrates how I put my technique into practice.

http://community.qlik.com/docs/DOC-5811

0 Likes
8,032 Views
MK_QSL
MVP
MVP

Thanks Neil...

0 Likes
7,993 Views
Jason_Michaelides
Luminary Alumni
Luminary Alumni

EDIT: I have uploaded a document explaining this - Customisable Straight (and Pivot) Tables - more food for thought

Hi all,

Seeing as this is a hot topic right now I'll whet your appetites with an even more flexible approach and at the same time commit myself to writing the doc I have intended to write for a while now, within the little while...

For now here's the basic(ish) premise of my preferred approach and the expansions over the above solutions...

The one challenge with the above approach is that all expressions that might possibly be required must be set up on the chart(s) in advance, then conditionally enabled based on data island selections as described above. Any new expressions must be added to the chart itself which can be cumbersome as the chart can become difficult to maintain and can also get bloated (I have no empirical evidence, but I'm pretty sure the more expressions that are added the slower and more fragile the chart becomes, even if not many are enabled at a time). What if you have hundreds of possible dimensions and measures for the user to choose from, but maybe only 20 or so are required at a any one time?

The other thing to consider is the left-to-right order the user might want his chart. With the above approaches the only way to adjust the expression order is with a macro which I try to avoid if possible.

The solution is the wonderful function FirstSortedValue().  I encourage you to view the excellent 2-part tutorial on this function given by Deepak Vadithala (DV) on QlikShare here - FirstSortedValue()

I will provide full details and examples soon, but for now, for each customisable chart, load a data island of dimensions and a separate data island of expressions.

Dimension:

%Dimension_Name - this will be the list the user sees

%Dimension_Explanation - can be used in comments or elsewhere to provide colour to the user

%Dimension_Group - enables grouping of dimensions for the user

%Dimension_Order - default left-to-right order for the expressions

Measure:

%Measure_Name - this will be the list the user sees

%Measure_Explanation - can be used in comments or elsewhere to provide colour to the user

%Measure_Group - enables grouping of measures for the user

%Measure_Expression - this is the expression needed to calculate this measure (no '=' sign at the start)

%Measure_Format - a default format for the expression e.g. #,##0.00;-#,##0.00

%Measure_Order - default left-to-right order for the expressions

When you load these tables (I often load from a spreadsheet as it is easier to maintain) be sure to declare the two _Order fields as INPUT FIELDS in the script.

Now, add (e.g.) 20 dimension fields and 20 expressions to your chart, but instead of an actual field, use:

$(='[' & FirstSortedValue(%Dimension_Name,%Dimension_Order,1) & ']') for the first dimension

$(='[' & FirstSortedValue(%Dimension_Name,%Dimension_Order,2) & ']') for the second dimension

etc etc and

$(='[' & FirstSortedValue(%Measure_Name,%Measure_Order,1) & ']') for the first expression

$(='[' & FirstSortedValue(%Measure_Name,%Measure_Order,2) & ']') for the second expression

etc etc

For the enable conditions, Dim1 just needs GetSelectedCount(%Dimension_Name) >= 1, Dim2 just needs GetSelectedCount(%Dimension_Name) >= 2 etc and Expr1 just needs GetSelectedCount(%Measure_Name) >= 1, Expr2 just needs GetSelectedCount(%Measure_Name) >= 2 etc

If you then give the user the ability to change the _Order fields (remember they are input fields) then not only can the user choose from a list of potentially hundreds of expressions, they can order the columns too. Richard Pearce has a great way of making this step very interactive and simple for the user. I'll post it (with his permission) along with the more detailed post later.

And the best thing? The user can then save their selections as a bookmark (with the Input Field Values also saved) and call it back at any time 🙂

This is a great thread - hope I have added something useful to it!

Laters,

Jason

Calibrate Consulting.

EDIT: I have uploaded a document explaining this - Customisable Straight (and Pivot) Tables - more food for thought

7,993 Views
neilhepburn
Partner - Contributor III

Look forward to seeing an example of this Jason - providing more control over column order would be great!

For now, users just manually move columns around, but a default order would help.

0 Likes
7,993 Views
kalyandg
Partner - Creator III

hi Jennell,

very nice post

0 Likes
7,993 Views
Not applicable

Hey guys, 

I am given a task to calculate the frequency of calls across a territory. If the rep called a physician regarding the sale of the product 5 times, then frequency is 5 and HCP count is 1....I generated frequencies from 1 to 124 in my pivot table using a calculated dimension which is working fine. But my concern is :

My manager wants frequencies till 19 in order from 1..2..3..4...5..6.....19...

And from the frequency 21-124 as 20+.

I would be grateful if someone helps me with this.....Eager for the reply....

0 Likes
7,993 Views
Jason_Michaelides
Luminary Alumni
Luminary Alumni

I think this belongs in a question of its own, Abhi...

0 Likes
7,993 Views
Jason_Michaelides
Luminary Alumni
Luminary Alumni

Seriously Abhi - please do not pollute unrelated threads. Please put into a question of its own.

0 Likes
7,943 Views
Not applicable

Jason,

Thanks for taking the time to add your method.  I am excited to see your update when you have the time.

7,943 Views