Announcements
Qlik Connect 2024! Seize endless possibilities! LEARN MORE
hic
Former Employee
Former Employee

Several aspects of the Qlik search mechanism has been described in previous posts. There is however one that has not been covered: Search in dual fields, e.g. dates. This post will try to explain the basics.

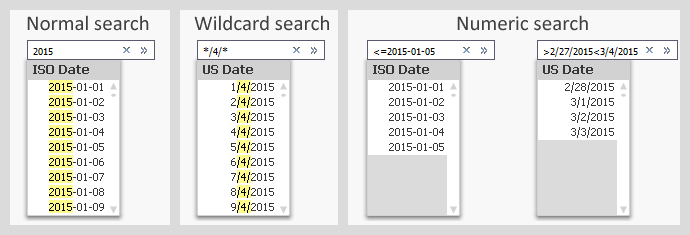
When making searches in text fields, you can search either by using a normal search or by using a wildcard search, and when you search in numeric fields you can use a numeric search. But what about dual fields, like dates, where you have both a textual and a numeric representation?

The answer is displayed in the picture below.
search h.png

Normal searches and wildcard searches are straightforward and need not be explained. Numeric searches are also possible and do pretty much what you expect them to.

You should however note that the search string in a numeric search must contain the correct formatted date. It is in most cases not possible to use the numeric value of the date. E.g. you cannot search for 42005 when you want Jan 1st 2015, even though this is the value of the date.

The same logic is used in Set Analysis, which means that a correct Set Analysis expression with a date could look like this:

Sum( {$<Date={"<=2015-02-28"}>} Amount)

Often you want the Set Analysis expression to be dynamic, and then you need to put a dollar expansion with an aggregation function inside it. One case is that you want to compare the selected month with the preceding month. In principal, the solution is something similar to the following:

Selected (Last possible) month:     Sum( {$<Month={"$(=Max(Month))"}>}  Amount )
2nd Last month:                                    Sum( {$<Month={"$(=Max(Month)-1)"}>}  Amount )

The Max(Month) will calculate the last possible month, and the dollar expansion will enter this value into the expression before the expression is parsed.

How the expression looks after the dollar expansion can be seen in the column header of a QlikView table. The above formulas have been used in the table below. Note that the dollar expansions with Max(Month) have been replaced with numbers.

QV Table.png

So far, so good.

However, the above formulas will not work. First, if you have created the Month using the Month() function, the field is cyclic which means that December of one year has a higher numeric value than January the following year, although it comes before January. Hence, the Max() function will not respect the order of months belonging to different years.

Secondly, the Month field has a dual value. This means that the Max(Month) will return a numeric when you need the textual value (‘Dec’) in the Set analysis expression.

One solution is to use a sequential month instead, and format it the same way everywhere:

Script:

Date(MonthStart(Date),'MMM-YY') as Month,

Expressions:

Sum( {$<Month={"$(=Date(Max(Month),'MMM-YY'))"}>} Amount )
Sum( {$<Month={"$(=Date(AddMonths(Max(Month),-1),'MMM-YY'))"}>} Amount )

Here the field Month is a date - the first day of the month - but formatted with just month and year. In other words: A number that equals roughly 42000 and is formatted as ‘Jan-15’. The same formatting is applied inside the dollar expansion. Note the column headers below.

QV Table2.png

Often it is practical to put the calculation of the Set analysis condition in variables. This way, the formula is kept in one place only and the Set analysis expressions become simpler and easier to read:

Script:

Set vLastMonth=      "=Date(Max(Month),'MMM-YY')";
Set v2ndLastMonth= "=Date(AddMonths(Max(Month),-1),'MMM-YY')";
Date(MonthStart(Date),'MMM-YY') as Month,

Expressions:

Sum( {$<Month={"$(vLastMonth)"}>} Amount )
Sum( {$<Month={"$(v2ndLastMonth)"}>} Amount )

Note that the variable definitions start with equals signs. This way they will be recalculated at every click.

Summary: Format the dates used inside Set analysis expressions, and use variables to simplify the expressions.

HIC


Further reading related to this topic:

The Search String

Data Types in QlikView

Cyclic or Sequential?

A Primer on Set Analysis

32 Comments
mayankraoka
Specialist
Specialist

Nice one.....

0 Likes
32,955 Views
mrooney
Contributor III
Contributor III

Hi Henric,

I undestand what you say about properly date formatting. Right.

But don't you think it's far better to create sequential 'yearmonth' values in calendars in order to use them inside set analysis? I think it's not only more clear but, i guess, more effcient too. Am I right?

Best regards.

MR

0 Likes
32,955 Views
hic
Former Employee
Former Employee

If you with a "sequential yearmonth" mean an integer defined as e.g.

    12*Year + Month as yearmonth

I would say that it would work, but I don't see the advantage. You would not need the Date() function inside the Set Analysis, that's true, but apart from that I can't see any big difference.

You could just as well define your yearmonth as

     Num( MonthStart( Date ) ) as yearmonth

and get the same effect. This definition has the added advantage that all date functions work flawlessly:

      Year( yearmonth )

      Month( yearmonth )

      Date( yearmonth, 'YYYY-MM' )


From a performance perspective, there should be no difference.

HIC

0 Likes
32,955 Views
lars_plenge
Partner - Contributor III

Hi Henrik

I hope you can help, My issue is also about Dates in set analysis.


sum(aggr(NODISTINCT sum ({<KEY_Date = {42431,42432,42431}>}ITEM_COUNT),Calender.Date))

Date

ITEM_Count

42431

10

42431

10

42432

15

The result is only 25 because the duplicated date is ignored.

How can I fix my expression so I get 35.


Best regards

Lars Plenge

0 Likes
32,955 Views
hic
Former Employee
Former Employee
  • I don't see why you need Aggr(). Just use Sum(ITEM_COUNT)
  • If you still need to use Aggr(), you should not use NODISTINCT. Just remove that qualifier.
  • Which formats do the dates really have? Check in a listbox where you don't have any number formatting. You should use the same format in your Set Analysis.

If you after checking the above still have a problem, I suggest you post this question in a thread of its own.

See also on Pitfalls of the Aggr function

Good luck.

HIC


0 Likes
32,955 Views
swuehl
MVP
MVP

Hi Henric,

I've recently suggested some topics for your series of blog posts.

May I suggest another one?

(Not) all animals are created equal

Consider this INLINE table LOAD (BTW: using QV12IR, but same results on QV11.20 SR11):

LOAD Date(Num) as Date,

  Date(Num,'MM/DD/YYYY') as Date2,

  MonthName(Num) as Month,

  Num(Num,'#.00') as NumDec,

  Num,

  100 as Value;

LOAD * INLINE [

Num

42469

];

(you probably already know what I want to show here)

If I then create a straight table chart with dimension Num and some expressions with set expressions according this blog post:

2016-04-09 17_12_20-Edit Expression.png

I do get the expected results:

Num Sum({<Date = {'09.04.2016'}>}Value) Sum({<Date2 = {"04/09/2016"}>}Value) Sum({<Month = {'Apr 2016'}>}Value) Sum({<NumDec = {"42469.00"}>}Value)
100 100 100 100
42469100100100100

What if I remove the explicite formatting in the field modifier:

imageFile.png

??

Num Sum({<Date = {'09.04.2016'}>}Value) Sum({<Date2 = {'04/09/2016'}>}Value) Sum({<Month = {'42461'}>}Value) Sum({<NumDec = {'42469.00'}>}Value)
100 100 0 100
424691001000100

And what if I do a numeric search?

Num Sum({<Date = {">0"}>}Value) Sum({<Date2 = {">0"}>}Value) Sum({<Month = {">0"}>}Value) Sum({<NumDec = {">0"}>}Value)
0 0 100 100
4246900100100

Hm...

Though all fields are created as duals, using Qlik Date&Time functions or Num(), the results are not consistent, at lease I can't see a reason why they should differ.

I thought about that maybe the tag (like $date) is somehow controlling the behaviour, but there seems to be no difference in field tags.

I can see that returning a dual from Max() function might be useful (though the Help says it's returning a numeric, and it's not returning a dual in every cases, as we see), though I think this behaviour was different in older QV versions, returning a numeric in every case.

To question something on top of the Max() behaviour, why is

=FirstSortedValue(Date, -Num)

returning 42469, where I would assume it should return the dual value here?

Seems like I haven't really understood the basics of dual value handling in QlikView in all these years

Hope you can shed some light on this, probably best in a different thread / blog post.

Best,

Stefan

32,955 Views
juleshartley
Specialist
Specialist

I agree with Stefan - I've come across confusing situations with Duals where the behaviour did not match my understanding based on what I have read, particularly with reference to set analysis.. clarification would be useful.

0 Likes
27,303 Views
isaaclin
Contributor III
Contributor III

Valuable information, thank you!

0 Likes
27,303 Views
Not applicable

I'm trying to use set analysis to pull a date completely out of a line graph.

Sum({$<CurDay -={"$(=Date(Date#('5/30/2016','MM/DD/YYYY'),'MM/DD/YYYY'))"}>}[Causal Total Time])

This what I tried.. ^^ My dimension for date is "CurDay", my measurement is "Causal Total Time"... I am showing the amount of downtime over the period of days but do not want to include May 30, 2016 in my graph.

How can I pull that date from my data completely?

0 Likes
27,303 Views
hic
Former Employee
Former Employee

If CurDay has been interpreted as a date (at load time) and is formatted according to 'MM/DD/YYYY', then your expression ought to work.

I would however define a flag in the script, e.g.

If(CurDay=MakeDate(2016,5,30),0,1) as IsIncluded,

and then use this in my set analysis expression:

Sum({$<IsIncluded ={1}>} [Causal Total Time] )


Its clearer, and you can debug what happens by looking at the flag.

HIC

0 Likes
27,303 Views