Michael_Tarallo
Employee
Employee

332f5e2.jpg
My buddy from down under is back in this week's edition of the Qlik Design Blog. Lee Mathews, Qlik Principal Solution Architect based in Melbourne Victoria, Australia, shows and tells how Qlik Sense can be used for financial reporting.

Financial Reports with Qlik Sense

I often have customers asking how they can produce financial style reports in Qlik. These reports are actually quite difficult to produce in most BI systems, as they usually require calculations and formatting that needs to change row by row. Most BI systems produce tables of data that display a single calculation in each column, with a dimension being used to provide a breakdown for the rows. Qlik is actually no different in this regard, however there are several aspects of the Qlik platform that provide the flexibility to replicate structured financial reports. Let me briefly introduce these aspects below:

  • Qlik’s powerful Extract Transform and Load (ETL) capabilities make Qlik the ideal platform for combining and reporting on data from disparate systems. But these ETL capabilities also allow you to take a data set and restructure it to include the necessary sub-totals that must be displayed in a financial report for example. You can also then flag these sub-totals in the data model so that different formatting can be applied to them in the UI.

  • Qlik’s extensive APIs allow visualization extensions to be created easily, with formatting options specifically for structured financial reporting. Two such extensions are illustrated in the video below, along with the use of the standard Qlik Sense pivot table object.

  • Qlik’s flexible expression syntax allows for a variety of tricks, to ensure that the right expression is displayed on each row. This includes Pick/Match functions, If Then Else logic, and of course Qlik’s powerful set analysis capabilities.

3-27-2018 10-40-08 AM.png

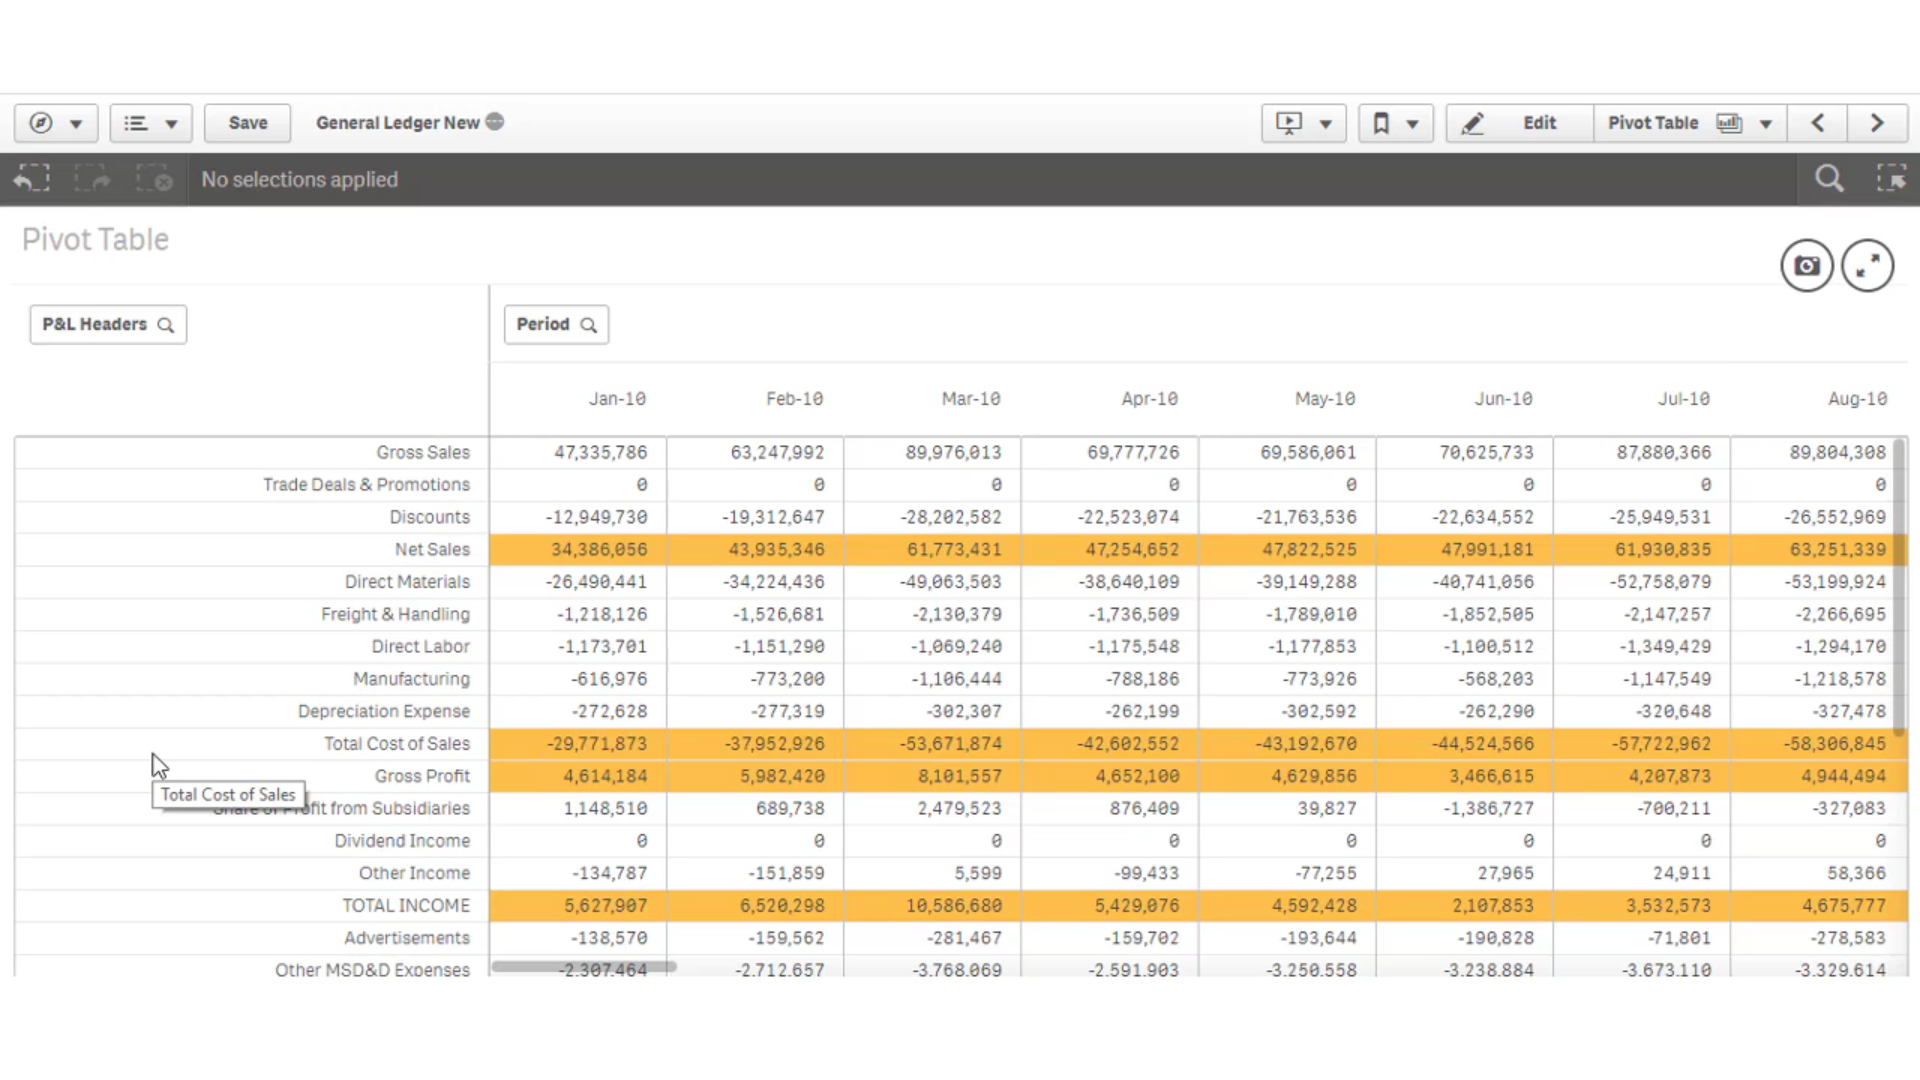
The short video below shows several approaches to producing structured financial reports. It is by no means an exhaustive list of techniques, but is a good overview of some of the options available.

Enjoy!

Lee Matthews
Principal Solution Architect

Qlik Sense for Financial Reporting

Can't see the video? Download the .mp4 to watch on your computer or mobile device.

Tags (1)
12 Comments
eliran
Creator III
Creator III

Great overview, thumbs up for Lee.

mto, I hope in the future, these things will come as a standard inside the product, and not as an extension, some of Qlik's customers are not thrilled to use the extensions for all sort of reasons.

BR,

Eliran.

8,145 Views
Anonymous
Not applicable

Great overview Lee! Good summary of the different options available. As you mention at the end of the video there are some commercial (supported) options available. Our P&L extension is one such option. Have a look at this video for more info: The Climber P&L Extensions for Qlik Sense | Michael Nordström - YouTube.

The setup is a monthly subscription which include a getting started template, updates and fixes and of course support.

Kind regards

/Michael

0 Likes
8,145 Views
b_garside
Partner - Specialist

eliran.s‌  I second your sentiment. Third party extensions should be more the exception vs. the norm for something like this...

8,145 Views
Anonymous
Not applicable

Eliran & Brian, I agree with your comments. This is one of the main reasons we haven't looked at Qlik Sense for our financial reporting. The standard pivot table should be able to be customized for financial reports in stead of using extensions. Totals and sub totals also should be calculated on the front end and not built into your model. With the standard pivot table its not possible to display totals at the bottom and therefore net profit etc. needs to be build into the model which creates a whole lot of issues.

0 Likes
8,145 Views
Lee_Matthews
Former Employee
Former Employee

Hi henster36 and eliran.s‌ and Brian

Thanks for your feedback. I have actually raised a suggestion on our internal 'suggestion box' about adding this sort of functionality to the Qlik Sense standard table object. A customer suggestion channel was recently established on Community here: Qlik Sense Idea Section is BACK Baby! so please add your own voices regarding this requirement.


Financial reports will always be difficult to replicate in a BI platform, as the calculations can potentially change across both the rows and the tables. I agree that building subtotals into the data model is not ideal, which is why I came up with the Transposed table. The pivot table object is not the ideal way to enable this capability, as the logic behind it needs to be flexible enough to facilitate constant pivoting of columns & rows. (Combine that with constant changing of expressions based on columns and rows and the logic would get very hard to manage). This is why I would like to see the standard table object transposable, which (along with a few other tweaks) would cover most requirements. In the meantime I hope you can leverage the Transposed Table extension.


Note that I just updated the documentation to show how you can create complex reports with changing column logic as well as row logic. Take a look at the section at the end of the Word document that is available for download with the extension at the following link: https://github.com/leematthewshome/Qlik-Sense-Transposed-Table-Extension


Regards

Lee

8,145 Views
Anonymous
Not applicable

Hi Lee!

Thanks for the link to your extension.

We also see Customers that have tools like Hyperion Essbase, where basically every level of KPI has different aggregations and number formating --> so this data structure is definitely not Pivot table as we can't sum up from bottom to top.

Most important for these customers is to have a table of expandable/collapsible KPIs, otherwise we would show them a List of > 200 KPIs

In QlikView one can misuse the Treeview-Listbox to achieve something similar when you have a unique "Path" to each KPI. See screenshot below. Have you come across something similar in Qlik Sense? Would it be easily possible to expand your "Transposed Table" extension so it becomes expandable/collapsible?

Thx, Roland

0 Likes
8,145 Views
Lee_Matthews
Former Employee
Former Employee

Hi Roland. That would be difficult to achieve with the Transposed Table extension. There is currently no logic to create expand/contract hierarchies, and you would need to add a calculation for every row, which would be quite time consuming. However I think it could be easily achieved with the Smart Pivot extension, which is the final one featured in the video (albeit without sparklines).

0 Likes
6,846 Views
Anonymous
Not applicable

Hi Lee!

Just doublechecked: I'm not able to expand collapse rows in the "Smart Pivot" extension. It only intends rows. I will check if it's possible with the Climber P&L Extension!

Thx,

Roland

0 Likes
6,846 Views
Anonymous
Not applicable

Something like this? (Very bad example probably but still )Multiple KPIs.gif

6,846 Views
petercappelle
Partner - Contributor III

Hi Michael,

This is really a very good extension but way to expensive!

We have many customers who really need an extension like this one but in no way they would pay 800-1500€/month.

0 Likes
6,846 Views