Unlock a world of possibilities! Login now and discover the exclusive benefits awaiting you.
- Subscribe to RSS Feed
- Mark as New
- Mark as Read
- Bookmark
- Subscribe
- Printer Friendly Page
- Report Inappropriate Content
During the last days we have been working in a new visualization piece that will be live soon in The Telegraph website. We got some data with daily refugees arrivals to different countries, the goal was to visualize how many people have moved across Europe during the last few months in a map, but we also wanted to plot a line/area chart with the cumulative number of arrivals per country and per day so you can see trends and evolution over time. Our data set included daily data but it didn't contain cumulative numbers so we had to calculate them.
The calculation should be something like this:
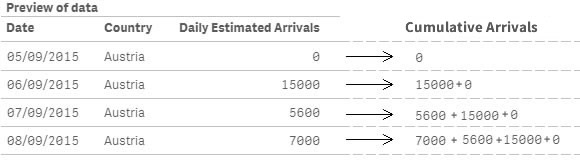
If is the first row or country is different than previous row country, then load the field value, else load the field value plus same field previous row value.
Step 1 Data Load
Start by loading our data table with the daily arrival values by country.
//Load the main table
DataLoad:
LOAD
    "Date",
    Country,
    "Daily Estimated Arrivals"
FROM [lib://LibraryName/Data.qvd] (qvd);
The generated table will look like the picture below:
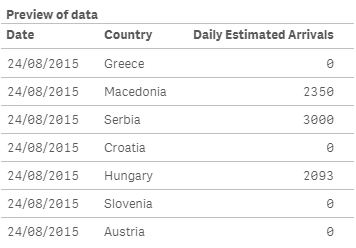
As you can notice the data is not sorted in a way that will let me successfully calculate the new field as I designed it because it will mix data from different countries, so my next move will be to sort the table by country and date.
Step 2 Sorting the table
//Sorting the table
SortLoad:
NoConcatenate Load
  "Date",
    Country,
    "Daily Estimated Arrivals"
Resident DataLoad
Order by Country, Date;

Drop table DataLoad; //Deletes the previous table no longer needed
Because I’m using a Resident Load statement to load and sort the values from the previous table, and both tables have identical field sets, I need to specify NoConcatenate before the load, otherwise both tables will be automatically concatenated. Using ‘Order By’ clause will sort the table by Country and then by Date. Finally, because the first table DataLoad will be no longer needed I’ll delete it using Drop Table.
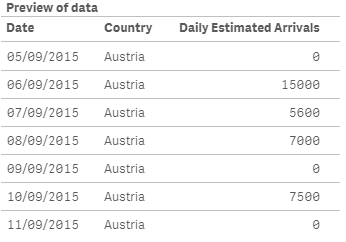
My new table will be as in the picture below
Step 3 Adding the calculated new field
Now that we have the data table ready we can finally calculate the new field to the table containing the cumulative daily estimated arrivals. To do so we will use the peek and previous script functions. Both functions are similar but they have some key differences that you should learn, please don’t miss this blog post: Peek vs Previous: when to use each
//Add cumulative data to the table
CummulativeLoad:
NoConcatenate Load
    "Date",
    Country,
    "Daily Estimated Arrivals",
    If(RowNo()=1 Or Country<>Previous(Country),
          "Daily Estimated Arrivals",
          "Daily Estimated Arrivals" +  Peek("Cumulative Daily Estimated Arrivals", RowNo()-2))
    as "Cumulative Daily Estimated Arrivals"
Resident SortLoad;

Drop table SortLoad; //Deletes the previous table no longer needed
Click on the image below to see how we created the new field to match with our calculation statement.

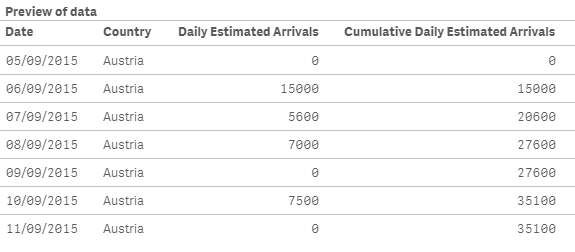
The final result will be a data table containing the fields to support both daily and cumulative charts.
Enjoy Qliking!
AMZ
(Note: I divided this example in 3 steps so hopefully it is clearer, but step 2 and 3 can be merged in one single step)
You must be a registered user to add a comment. If you've already registered, sign in. Otherwise, register and sign in.