Unlock a world of possibilities! Login now and discover the exclusive benefits awaiting you.
- Qlik Community
- :
- Discover
- :
- Blogs
- :
- Product
- :
- Design
- :
- Get Familiar with Qlik GeoAnalytics - The "Closest...
- Subscribe to RSS Feed
- Mark as New
- Mark as Read
- Bookmark
- Subscribe
- Printer Friendly Page
- Report Inappropriate Content
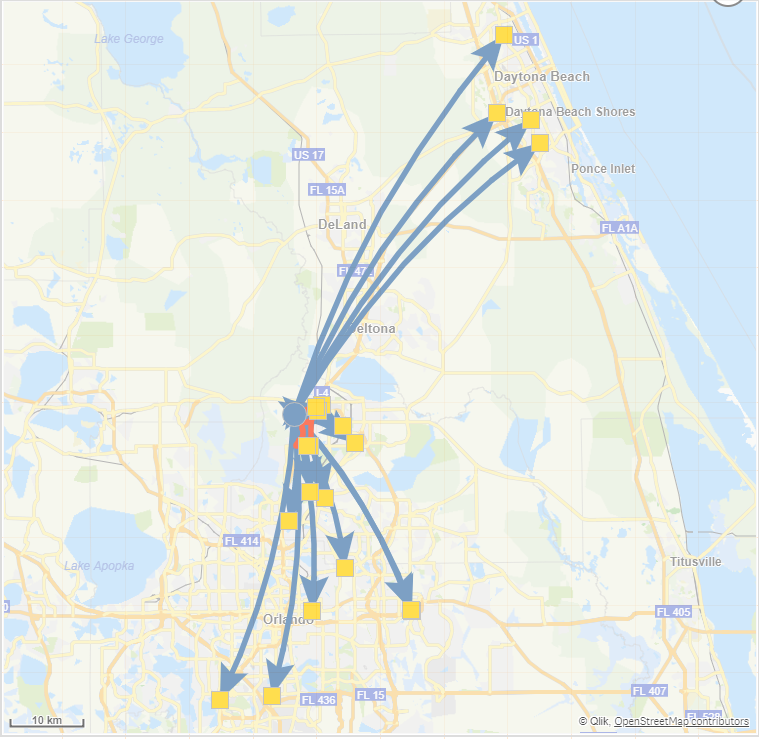
Hi guys - continuing my series on making your more familiar with Qlik GeoAnalytics, I build on my previous example where we used the Qlik Geocoding service to grab and plot coordinate points for our video game store street addresses. In this example we will use the "Closest" operator, available from the Qlik GeoAnalyics Connector, to see which stores are the closest to my "home" within in a 30 mile radius. We will even take this to the next level and use a Line Layer to visual depict that distance as well. Watch or download the video and samples to learn more!
Qlik GeoAnalytics - The Closest Operator
Part 3: Get Familiar with Qlik GeoAnalytics - Custom Info Bubble
Regards,
Qlik
Can't see the video? YouTube blocked by your region or organization? Download the .mp4 video to watch on your computer or mobile device.
You must be a registered user to add a comment. If you've already registered, sign in. Otherwise, register and sign in.