Unlock a world of possibilities! Login now and discover the exclusive benefits awaiting you.
- Qlik Community
- :
- Discover
- :
- Blogs
- :
- Product
- :
- Design
- :
- Hidden gems in Qlik Sense geospatial functions
- Subscribe to RSS Feed
- Mark as New
- Mark as Read
- Bookmark
- Subscribe
- Printer Friendly Page
- Report Inappropriate Content
Today I'll be posting on behalf of Yang Yang who recently came up with this interesting article around the geospatial functions available in Qlik Sense, I'm sure you'll enjoy it.
Arturo
Qlik Sense is Gorgeous and Genius. So far, you probably have seen the intelligent visualizations that are out-of-the-box in Qlik Sense, including maps. What about advanced geospatial functions such as merging geometries or the converting spatial projections? Will those features be added in Qlik Sense product? I recently bumped into a few geospatial functions that are not yet well known. Here are the findings from my experimenting of those functions. The QVF and supporting data are also available for download at the bottom of the article.
Two categories of functions
There are two categories of these geospatial functions: aggregation and non-aggregation.
Aggregation functions will take the input of a set of geometries (points or areas) and output with one geometry. For example, you can merge multiple areas together and draw a single boundary for the aggregation on the map. On the other hand, non-aggregation function will only take the input of one geometry and then output one geometry. For instance, you provide the boundary geometry of one area to a function called GeoGetPolygonCenter, it will return the point geometry (longitude and latitude) for the center of that area.
There are two types of parameters that may required by the geospatial functions:
- Geometry, can be any of the following:
- a point (latitude, longitude)
- an area
- Projection, With Mercator projection you can represent maps in square format, correcting for the distortion created by stretching. This can be any of the following:
- 'unit' (default) - projection is 1:1
- 'mercator'
Aggregation functions
There are five aggregation functions available in the current release of Qlik Sense (1.0.1).
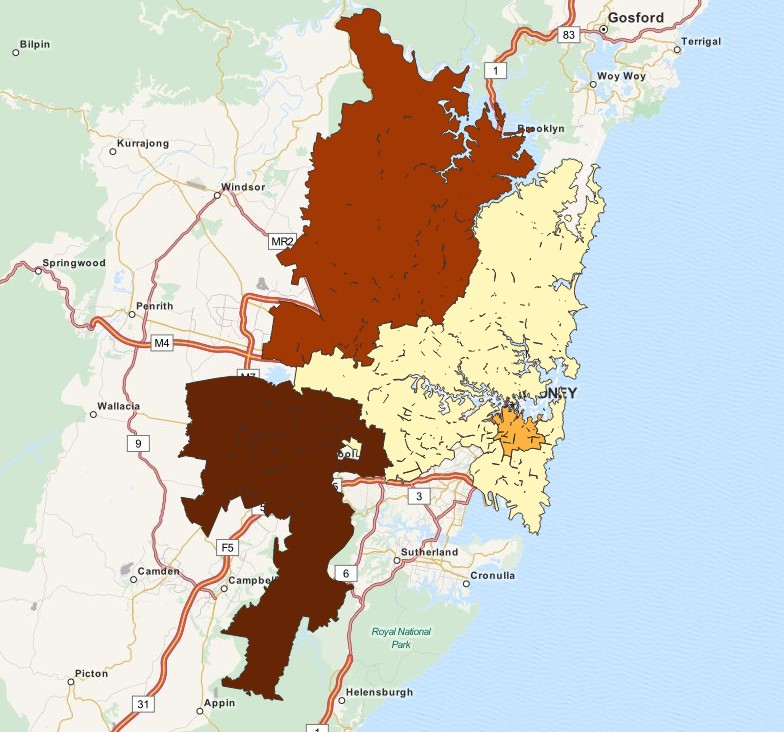
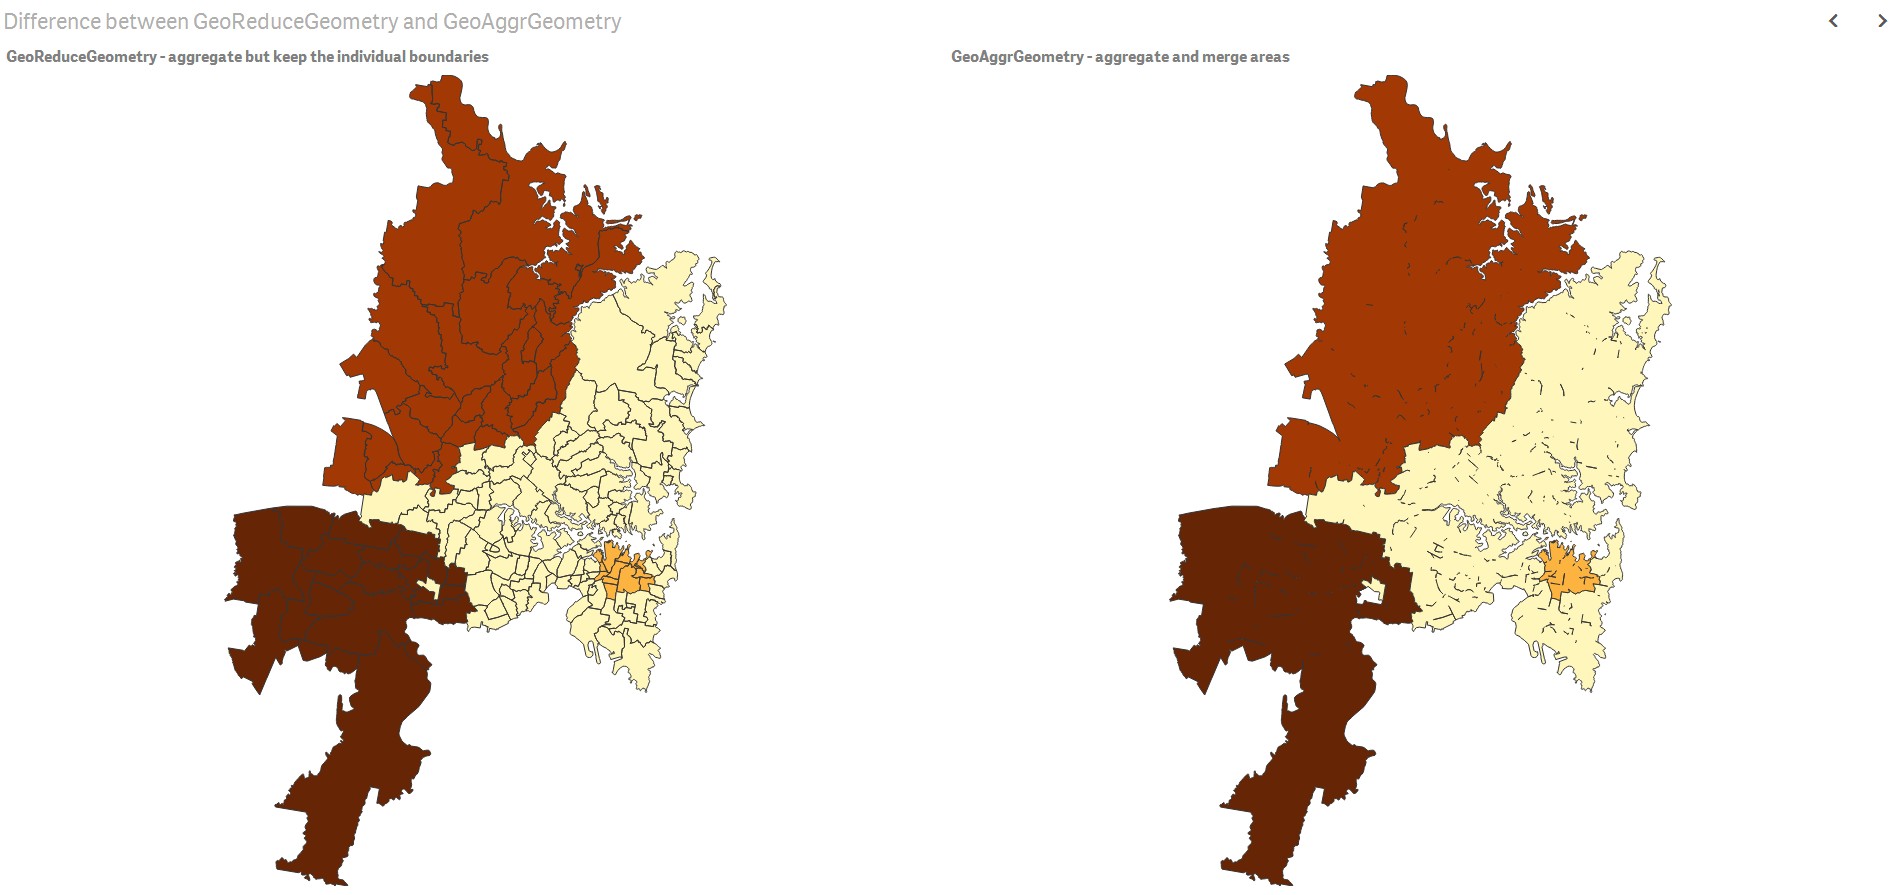
GeoAggrGeometry
This function can be used to aggregate a number of areas into a larger area, for example aggregating a number of sub-regions to a region.
GeoAggrGeometry(geometry).
A typical use case of this function is: A company has geospatial boundary data for each postcode areas in Sydney and the sales revenue from each area. A sales person has his or her sales territory that covers a number of postcode areas. The sales territory will be adjusted from time to time and there's no geospatial data for the boundary of this changing territory. How can the company present the total of sales by region on a color filled map?
With GeoAggrGeometry(), we can calculate the aggregation of multiple suburb level geometries and generated the merged territory geometry in the data model. If the sales territory changes, the new merged boundary can be reflected on map after the reload.
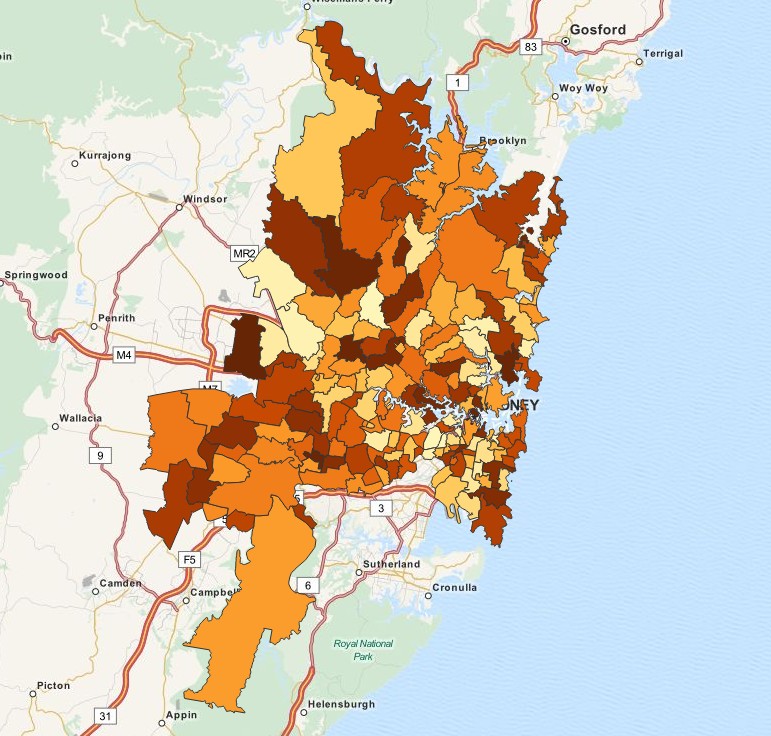
GeoReduceGeometry
This function can be used in scripts to aggregate a geometry into an area.
GeoReduceGeometry(geometry)
This function is similar to GeoAggrGeometry(). The only difference is, though the areas are aggregated, area level boundary lines are still kept on the map display.
GeoBoundingBox
This function can be used in scripts to aggregate a geometry into an area and calculate the smallest GeoBoundingBox that contain all coordinates.
A GeoBoundingBox is represented as a list of four values: left, right, top, bottom.
As explained above, this function will firstly aggregate a set of geometries together, then it will produce four coordinates for the smallest rectangle that contains all the coordinates of that aggregated geometry.
To visualize the result on map, you need to transfer the 4 coordinates string into ordinary polygon format, tag the transferred field with certain geopolygon format, drag and drop that field into the map object, then you can see rectangle boxes.
GeoInvProjectGeometry
This function can be used in scripts to aggregate a geometry into an area and apply the inverse of a projection.
GeoInvProjectGeometry(projection, geometry)
GeoProjectGeometry
This function can be used in scripts to aggregate a geometry into an area and apply a projection.
GeoProjectGeometry(projection, geometry)
Non-aggregation functions
There are four non-aggregation geospatial functions in the current release of Qlik Sense (1.0.1).
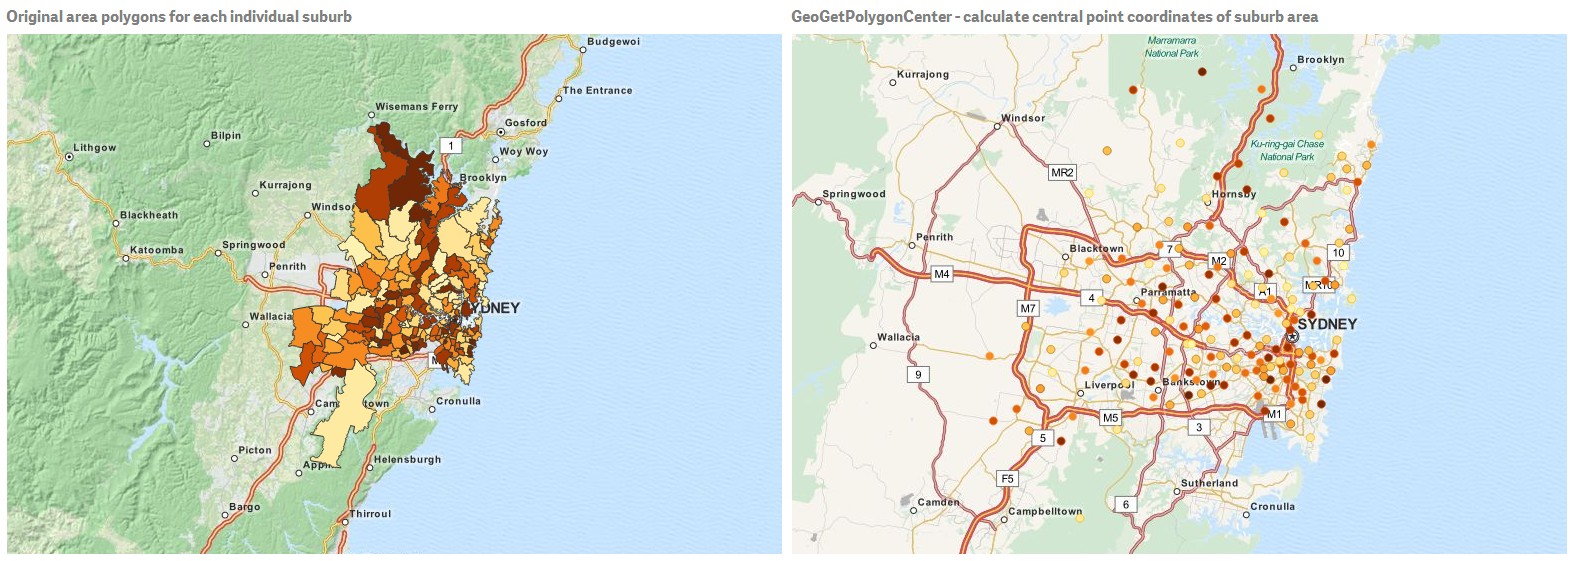
GeoGetPolygonCenter
This function can be used in scripts and chart expressions to calculate and return the center point of a geometry.
GeoGetPolygonCenter(geometry)
In some case, we want to plot dot instead of color fill on map. If the existing geospatial data is only available in the form of area geometry (e.g. boundary), we need function that can retrieve one pair of longitude and latitude for the center of area. Therefore, GeoGetPolygonCenter() is provided in Qlik Sense.
For example, we can still create bubble map like below to plot the central points of Sydney suburbs, though we only have boundary information in the data source.
GeoGetBoundingBox
This function can be used in scripts and chart expressions to calculate the smallest GeoBoundingBox that contain all coordinates of a geometry.
A GeoBoundingBox is represented as a list of four values, left, right, top, bottom.
As described in the previous section, with a few extra steps, you can visualize rectangle boxes on a map object.
GeoProject
This function can be used in scripts and chart expressions to apply a projection to a geometry.
GeoProject(projection, geometry)
This is a projection function for a single geometry. As explained in the previous section, this function will be useful for map areas that are close to the north or south pole.
GeoMakePoint
This function can be used in scripts and chart expressions to create and tag a Point with latitude and longitude.
GeoMakePoint(latitude, longitude)
Those non-aggregation functions can be called in load script. Error message will be thrown if they are used together with "group by" clause.
It's exciting to play with the brand new geospatial functions. When you enjoy discovering more business insights with those out-of-the-box features, please remember, this is just the beginning of Qlik Sense.
Yang Yang - Qlik Senior Solution Architect
You must be a registered user to add a comment. If you've already registered, sign in. Otherwise, register and sign in.