Unlock a world of possibilities! Login now and discover the exclusive benefits awaiting you.
- Subscribe to RSS Feed
- Mark as New
- Mark as Read
- Bookmark
- Subscribe
- Printer Friendly Page
- Report Inappropriate Content
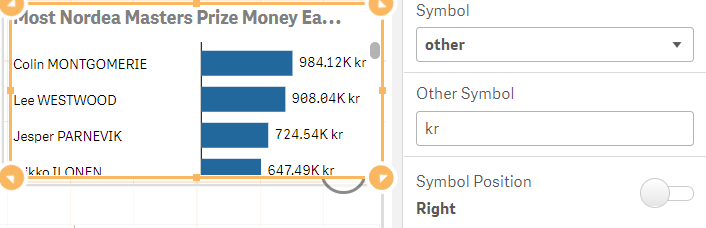
Last year I blogged about our Mobile Friendly Horizontal Bar Chart that we use in most of our mashups in the Qlik Demo Team.
Since then, many things have changed. For a start, if you have a mashup that uses many objects, you will see the load time to be much faster since I used d3.v4 and I have added a break point on how many bars to create, You can define if you want to show all or only the first 50.
I have also changed the currency. If you select the measure to be displayed as 'auto' then extension will use the custom format. You can abbreviate the measure with their respective symbol like 'B' for billions, 'T' for trillions etc and use your custom currency symbol
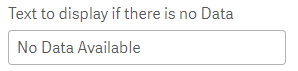
Another new feature is the custom text to display when there is no data. If you make a selection in the sheet and that produces no results then this text will be displayed.
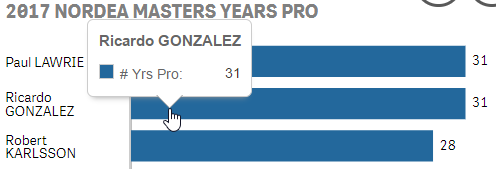
Also, the tooltip is more elegant now and different from the standard Qlik Sense one. I changed it to follow the mouse instead of always aligned center at the top of the bar
YIANNI
Files
You must be a registered user to add a comment. If you've already registered, sign in. Otherwise, register and sign in.