Unlock a world of possibilities! Login now and discover the exclusive benefits awaiting you.
- Qlik Community
- :
- Discover
- :
- Blogs
- :
- Product
- :
- Design
- :
- ICYMI: Gartner BI Bake Off Qlik Highlights - Analy...
- Subscribe to RSS Feed
- Mark as New
- Mark as Read
- Bookmark
- Subscribe
- Printer Friendly Page
- Report Inappropriate Content
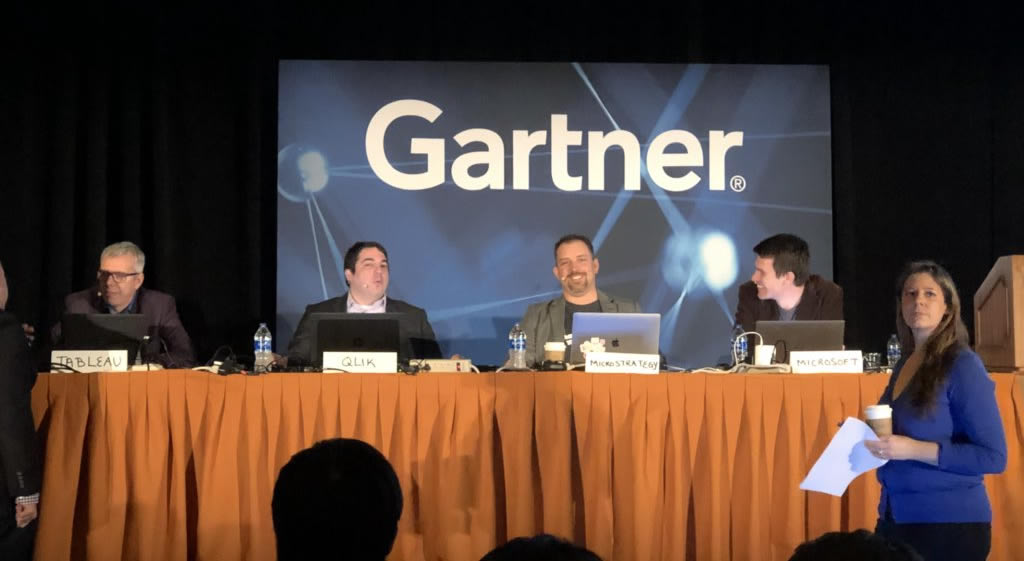
Hey Guys - if you have been following Qlik, then you know that once again Gartner has placed us as a leader in the Magic Quadrant for Analytics and Business Intelligence Platforms for the 8th year in a row ... AND.... you know that every year around this time we participate in a friendly, live, on-stage Business Intelligence competition know as the BI Bake Off. This informative and exciting session is held during Gartner's Data Analytics Summit and hosted by BI research VP Cindi Howson, previously of (@BIScorecard) fame. It's a time and place for Qlik and its competition (Tableau, Microsoft, MicroStrategy) to showcase their greatest strengths...and possibly expose a few weaknesses ![]() - in front of many organizations' data analytics leaders. Overall, despite our competitive spirit, it is an awesome experience and a fun time to be had by all. Our presenter Josh Good (@joshdotbad) - led an entertaining and interesting session, showcasing Qlik's solution.
- in front of many organizations' data analytics leaders. Overall, despite our competitive spirit, it is an awesome experience and a fun time to be had by all. Our presenter Josh Good (@joshdotbad) - led an entertaining and interesting session, showcasing Qlik's solution.

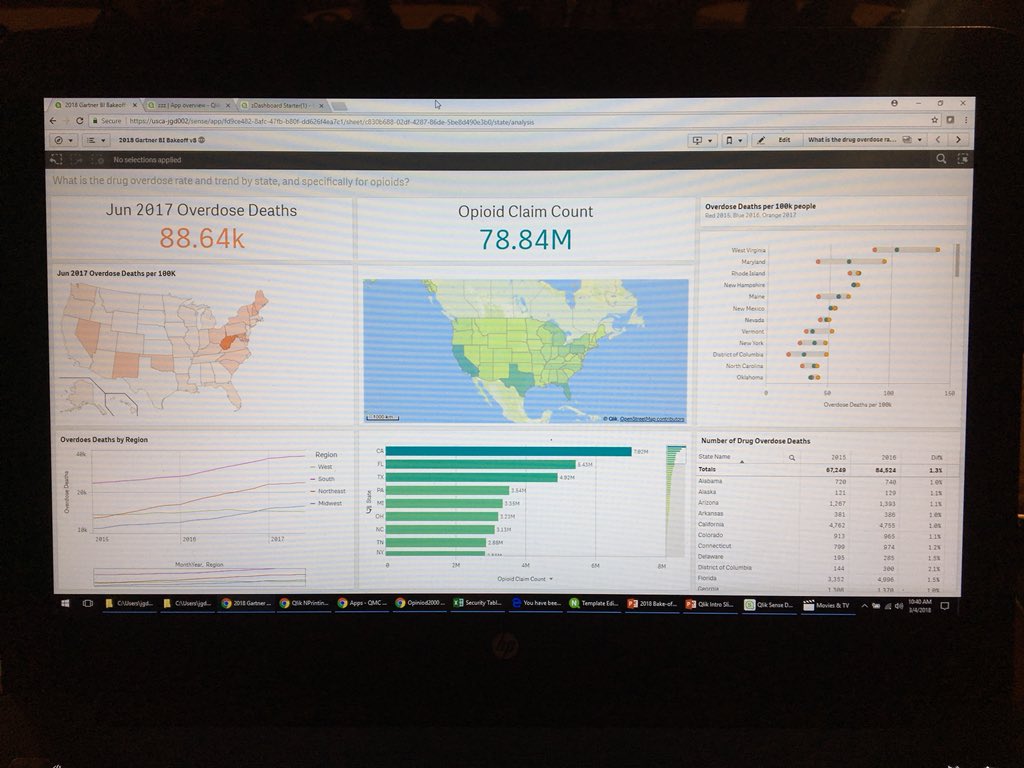
Prior to the event, the Qlik team prepares a solution following a provided script based off of a public data set given to them by Cindi. Data usually centers around a topic in which each vendor can show how they can "do good" with the data, which is consistent enough to facilitate a side-by-side comparison. In the past we have analyzed traffic fatalities, homelessness and college debt, but this year the data centered around the deeply emotional opioid epidemic plaguing this great nation.
During the session, each vendor takes turns using their software to present their analytics while showcasing the capabilities of their software within a few different categories.

Qlik on stage - on the big screen - BI Bake Off Gartner Data Analytics Summit
Take a brief look at Qlik's solution highlights reel presented for each topic and let us know what you think by leaving a comment, question below - the timecode links for the section categories are listed below:
Gartner BI Bake Off Qlik Highlights Reel
- Look and Feel: https://youtu.be/l0nplDrToMU?t=12s
- Data Preparation: https://youtu.be/l0nplDrToMU?t=1m54s
- Dashboard Building: https://youtu.be/l0nplDrToMU?t=3m37s
- Reporting and Mash-ups: https://youtu.be/l0nplDrToMU?t=4m30s
- Governed Self-Service: https://youtu.be/l0nplDrToMU?t=5m2s
- Cool Innovation: https://youtu.be/l0nplDrToMU?t=5m43s
To see an actual Qlik Sense product demonstration analyzing the Opiod Crisis check out this webinar presented by the Qlik Healthcare team: Analyzing the Opioid Crisis with Qlik - Webinar - YouTube
Analyzing the Opioid Crisis with Qlik - Webinar
We'd like to thank the entire Qlik team for a job well done as well as Gartner and Cindi for hosting another great event. Stay tuned to learn more about our future capabilities and be on the look for Cindi's take on the Bake Off on her blog space at Gartner.
Enjoy!
Michael Tarallo (@mtarallo) | Twitter
Qlik
Can't see the video? Access to YouTube restricted? Download the .mp4 attached to this post.
You must be a registered user to add a comment. If you've already registered, sign in. Otherwise, register and sign in.