Unlock a world of possibilities! Login now and discover the exclusive benefits awaiting you.
- Subscribe to RSS Feed
- Mark as New
- Mark as Read
- Bookmark
- Subscribe
- Printer Friendly Page
- Report Inappropriate Content
 Well guys - where do I begin? – Ah I got it, Happy New Year! <sigh> It feels like only yesterday that I was writing my first blog for 2017. However, after a long break, I’m excited to get back to work and contribute towards another prosperous year at Qlik! I didn’t want this to be another one of those “Year-in-review-type” posts…..so…I cleverly disguised it to highlight some of our product achievements during 2017.
  Think about it as a sitcom clip-show. So much Qlik goodness has transpired over the past year not only is it difficult to cover everything that has happened with the product, but as a consumer, I know it's difficult to keep track of it all, so I ‘ll do my best to summarize and consolidate where I can. This post is a bit long - so for some of you, I expect you to bookmark it and use it for later reference if needed.
ENTER TO WIN $50 Amazon Gift Card - Rules Below
So, let’s begin.
For those of you who want the short, short version:
- Qlik GeoAnalytics
- Qlik Sense 3.2
- QlikView Converter
- Qlik Sense Chat Bot
- Data Connectivity
- Qlik Sense June 2017
- Advanced Analytics Integration
- Qlik Sense September 2017
- Qlik Sense November 2017
- Qlik Sense Mobile
- Qlik's Associative Difference
Qlik GeoAnalytics
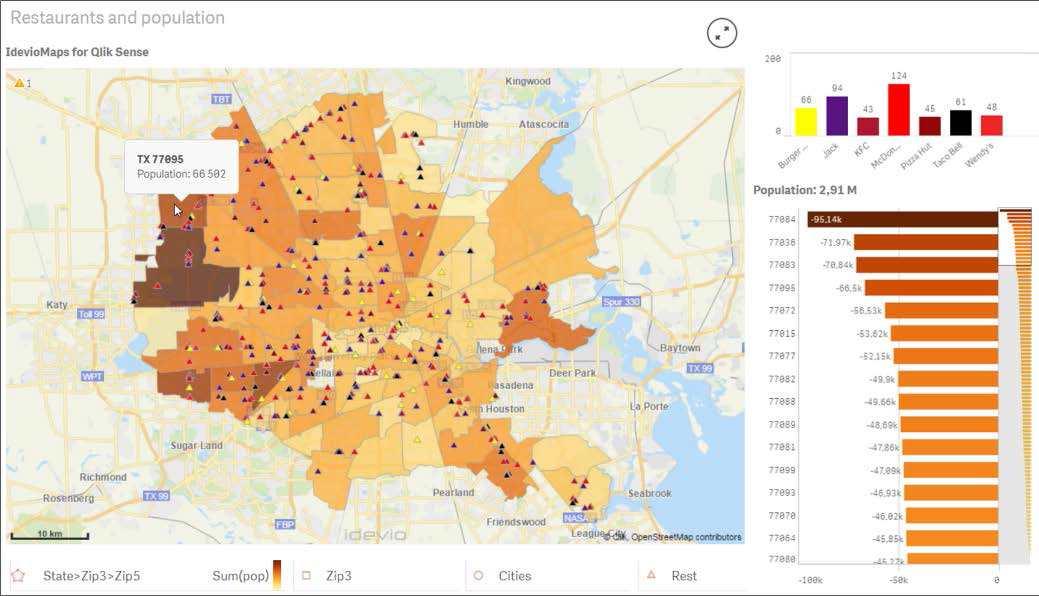 In January of 2017 – we kicked off the then new year with an acquisition of our Sweden-based partner, Idevio, creator of Idevio Maps. We introduced the recently acquired product as Qlik GeoAnalytics. Currently available as an extension for both Qlik Sense and QlikView, Qlik GeoAnalytics goes beyond traditional “points on a map” and adds a broader range of capabilities to support advanced geoanalytic use cases. During 2018 (no specific time-frame yet) we plan on integrating Qlik GeoAnalytics directly into Qlik Sense, so stay tuned.
ICYMI: Introducing Qlik GeoAnalytics
Qlik Sense 3.2
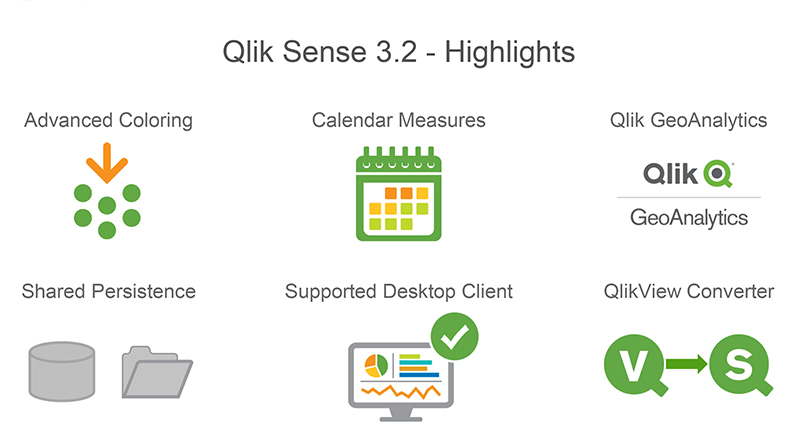
Soon after, in March 2017 - we announced our first release of Qlik Sense for the year, version 3.2. 3.2 added the ability to easily create time-based measures (Calendar Measures), included additional chart options to support custom colors and color assignments, introduced the QlikView Converter and added a new configuration to improve the performance and stability of multi-node deployments (Shared Persistence)
ICYMI: Introducing Qlik Sense 3.2
The QlikView Converter
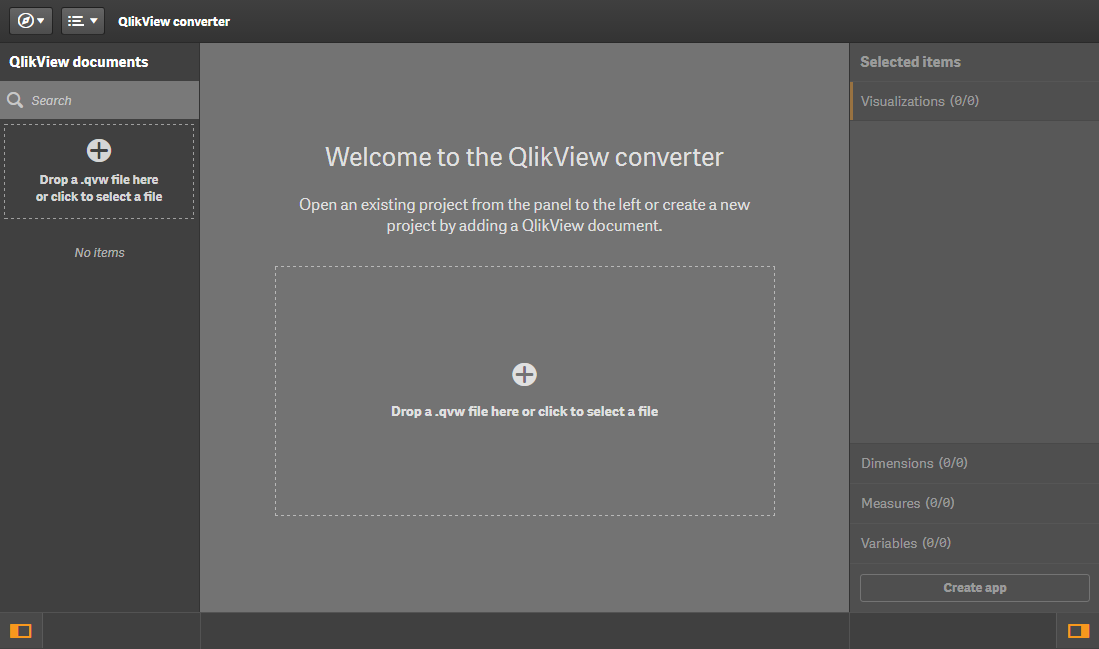 With version 3.2 we included a utility found in the Dev Hub that simplifies converting a QlikView document (.qvw) over to a Qlik Sense app (.qvf). You simply upload your .qvw to the converter to be analyzed, and it will extract the data model, script, measures, dimensions, expressions, variables and even compatible visualizations. The user can then choose what they want to convert to create a starter Qlik Sense app. Next they can create new or modify existing visualizations using the assets that were already available in QlikView.
ICYMI: QlikView converter - Qlik Sense - YouTube
Qlik Sense Chat Bot
 April 2017 set a new milestone for Qlik by pushing the boundaries of analytics. We demonstrated the art of the possible using the Qlik platform, its awesome APIs, and various 3rd party technologies - to create the first ever Qlik analytics chat bot. Simply stated, imagine getting your answers to your business questions by asking your digital assistant. Since the original bot debuted at the Gartner BI Bake-off and Qonnections there has been tremendous interest in this concept, which has evolved rapidly over the 2nd half of 2017. There is now a new community group: https://community.qlik.com/groups/qlik-chatbots with many supporting resources and our own Todd Margolis is leading the charge to help enable our community to take advantage of our two open-source Qlik Bots. Whether you’re a business user and want quick and easy access to your KPIs on the go or you’re a developer and want to extend them with new capabilities or integrate Qlik into your existing bots, we’ve got you covered.
ICYMI:
- Original Concept and video
- It's a Qlik Bot invasion
- Qlik Sense Bot with Node.js and Enigma.js
- Ask the Experts: Qlik Bot webinar presentation
Data Connectivity
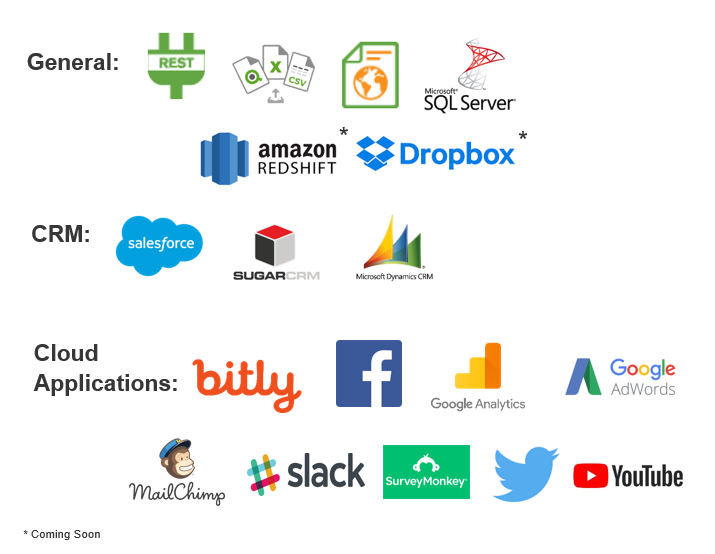 Over the course of 2017 Qlik Sense and Qlik Sense Cloud had many improvements, especially in the area of connectivity. In May we introduced the first integration of our Web Connectors package to Qlik Sense Cloud – starting with access to Twitter, Facebook and Google Analytics. Then in July we introduced on premise connections from Qlik Sense Cloud starting with MS SQL as well as the Web file connector. During 2017 we delivered over 20+ connectors to Qlik Sense and Qlik Sense Cloud Business including Dropbox, REST, Amazon Redshift, YouTube and many more.
ICYMI:
- Qlik Sense Cloud Business and the Web Connectors
- Qlik Web Connectors for Qlik Sense, QlikView and Cloud
- Qlik Sense Cloud Business Update - MS SQL, Web File and more!
Qlik Sense June 2017
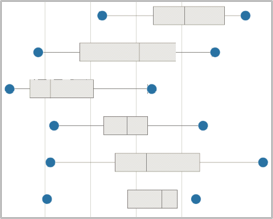
In addition to the aforementioned connectivity we also debuted our new release schedule and product naming convention when delivering Qlik Sense June 2017. No more dot releases for us – new releases are now identified by the month they are delivered in. June 2017 brought us new visualizations (Histogram, Distribution and Box plots), enhanced visual data preparation features that support data profiling and data quality and a new Advanced Analytics integration framework – allowing you integrate with advanced analytics engines such as R and Python.
ICYMI:Take a look at Qlik Sense June 2017
Advanced Analytics Integration
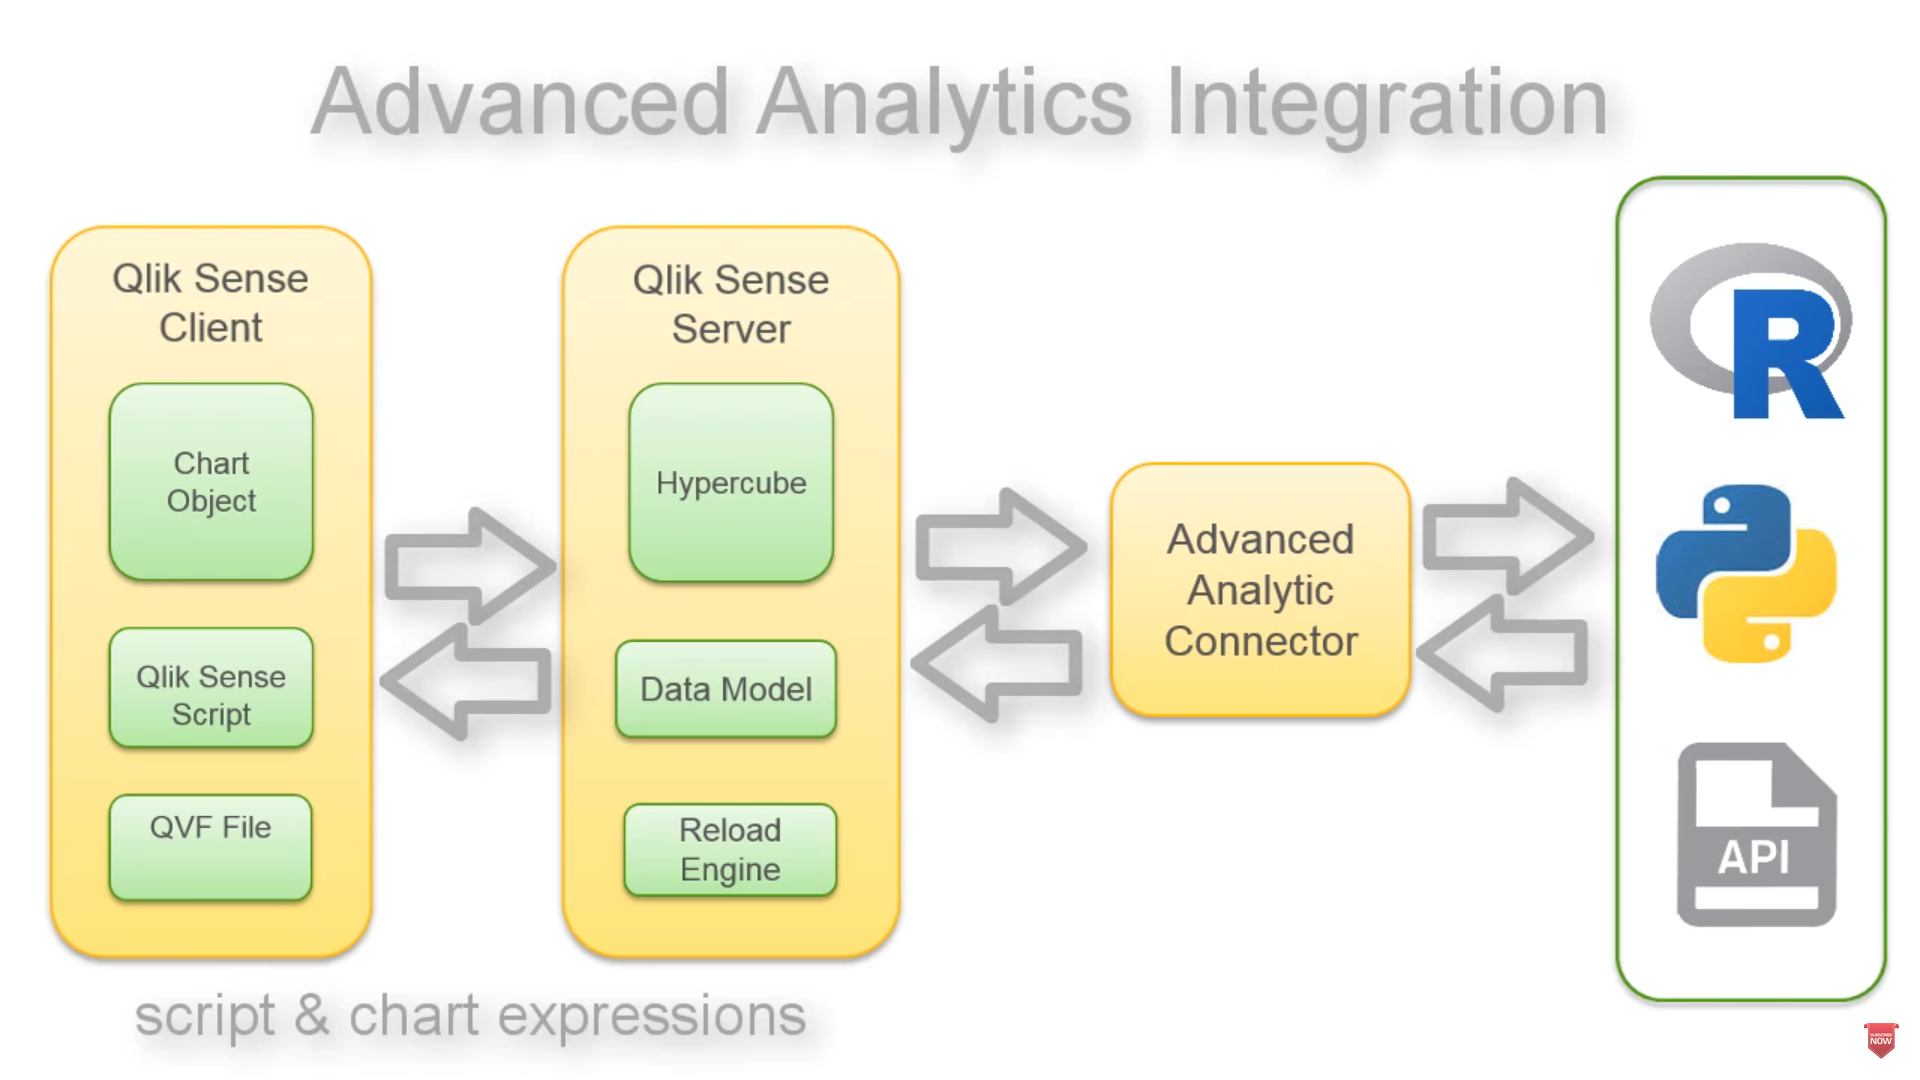
Qlik Advanced Analytics Integration (AAI) enables direct server to server data exchange between Qlik Sense and 3rd party calculation / analysis engines via a connector or what we also call a plugin. So for example, a specific forecasting function that is part of an R library can now be called from within Qlik script and chart expressions and calculated on the fly. Passing the results back to the Qlik analysis engine and subsequent visualizations. With this capability we now support the APIs that provide connectivity to such engines and provide starter connector projects for R and Python.
ICYMI: Introducing Qlik Advanced Analytics Integration
Qlik Sense September and November 2017
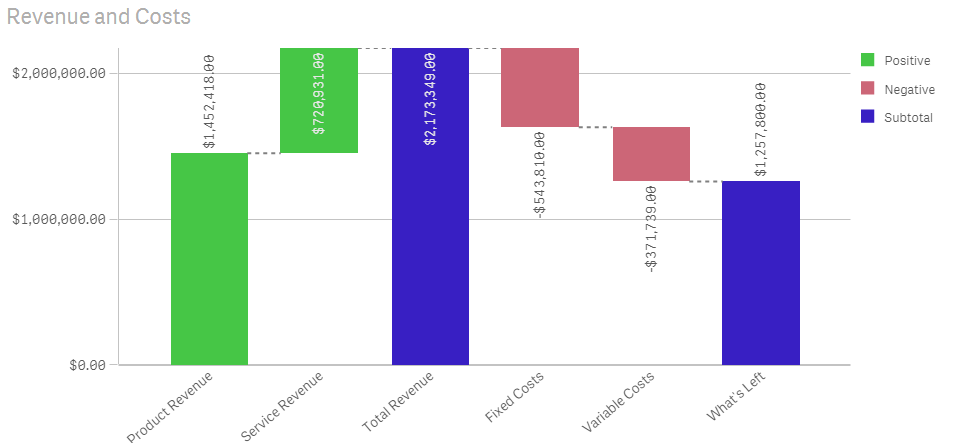
Continuing our commitment to deliver iterative improvements and features every 10 weeks, we released our September and November 2017 releases, which introduced our new Waterfall chart, continuous transformations using visual data preparation, our Qlik Sense Mobile app, visualization and navigation improvements and the introduction of our extension certification pilot.
ICYMI:
- Qlik Sense September 2017 - What's New
- What's New in Qlik Sense November 2017Qlik Sense September 2017 - What's New
- Certified Extensions - Coming to a Cloud Near You!
Qlik Sense Mobile (offline)
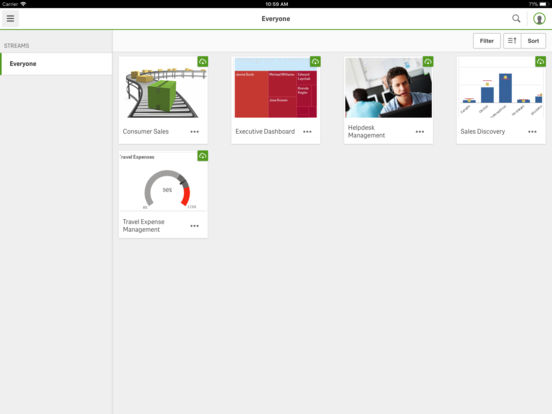
Originally released to select participants in June, the Qlik Sense Mobile app for iOS became available to customers and partners in the Apple App Store later in the year. This iOS app enables its users to connect to their Qlik Sense Enterprise Server and download a local copy of their Qlik Sense app directly to their iOS device where they can analyze data on the device just as if they were connected to the server, allowing them to take Qlik Sense with them on the go in a disconnected state. (at this time Qlik Sense Mobile is for iPad only – a version for the iPhone is expected to be release early this this year.)
ICYMI:
Qlik’s Associative Difference
 Finally, analytics is more than just creating charts, it’s about finding answers. Therefore, I’d like to give an honorable mention to our team, who has created resources to help our prospects, customers and partners clearly understand the benefits of Qlik’s Associative Difference, powered by our patented associative technology. Sometimes referred to by many different names (Associative Experience, Associative Model, Green-White-Grey), Qlik’s Associative Difference separates us from those traditional query-based visualization tools. Qlik’s Associative Difference allows you to explore data freely in any direction, automatically associating every dimension in the data model which visually reveals how the data are related using the colors green, white and grey - AND - without leaving any data behind.
ICYMI:
- My Pleasant Surprises - Qlik's Associative Difference
- Try it for yourself: Associative-Difference - Demo
Well guys – that’s it – your Qlik 2017 Year In Review – oh wait.  - I said I wasn't doing a "year-in-review" post, ah @#$%&!.
Personal Giveaway Rules:
Do you have some interesting Qlik highlights or discoveries during 2017 that you would like to share? We want to know. Post them in the comments below OR if you would like to participate in my personal giveaway with a chance to win a $50 Amazon Gift Card (claim code) post a tweet using twitter http://twitter.com/ with your 2017 Qlik highlight or discovery and tag me using @mtarallo along with the hashtag:
#Qlik2017Highlights
...you will then be entered into a reviewed, random drawing to receive $50 Amazon Gift Card(claim code). Winner will be selected using Qlik's Twitter Connector and Qlik Sense app which will draw a random tweet using the hashtag: #Qlik2017Highlights. Winner will be announced on Twitter by @mtarallo on February 6th 2018 [UPDATE: Feb 13th 2018] and in the Tuesday edition of the Qlik Design Blog. Entry must be an interesting or valid Qlik highlight or discovery - if not it will be discarded and the next entry will be selected at random.
Contest starts Tuesday Jan 9 2018 and ends on Tuesday Jan 30 2018. We want to hear from you!
Enjoy!
Regards,
You must be a registered user to add a comment. If you've already registered, sign in. Otherwise, register and sign in.