Michael_Tarallo
Employee
Employee

What is Advanced Analytics?


Gartner defines Advanced Analytics as:


The autonomous or semi-autonomous examination of data or content using sophisticated techniques and tools, typically beyond those of traditional business intelligence (BI), to discover deeper insights, make predictions, or generate recommendations.


What resonates with me here are the key words "sophisticated techniques and tools" - these can mean statistical analysis environments, (perhaps R), or general purpose and machine learning program languages (Python / MATLAB) or even specific operations used for pattern search (regex), just to name a few. So what does this have to do with Qlik? Well, let's say you have an investment in R, Python, MATLAB or even something custom you created for your advanced analytics activities. You may want to reuse or apply algorithms from those systems to data available in your Qlik environment, taking advantage of Qlik's associative model as well - how would you do that? Previously, you might have to export the data from those systems and then import and associate it within Qlik. Well not any longer now that we have Qlik Advanced Analytics Integration.


What is Qlik Advanced Analytics Integration?
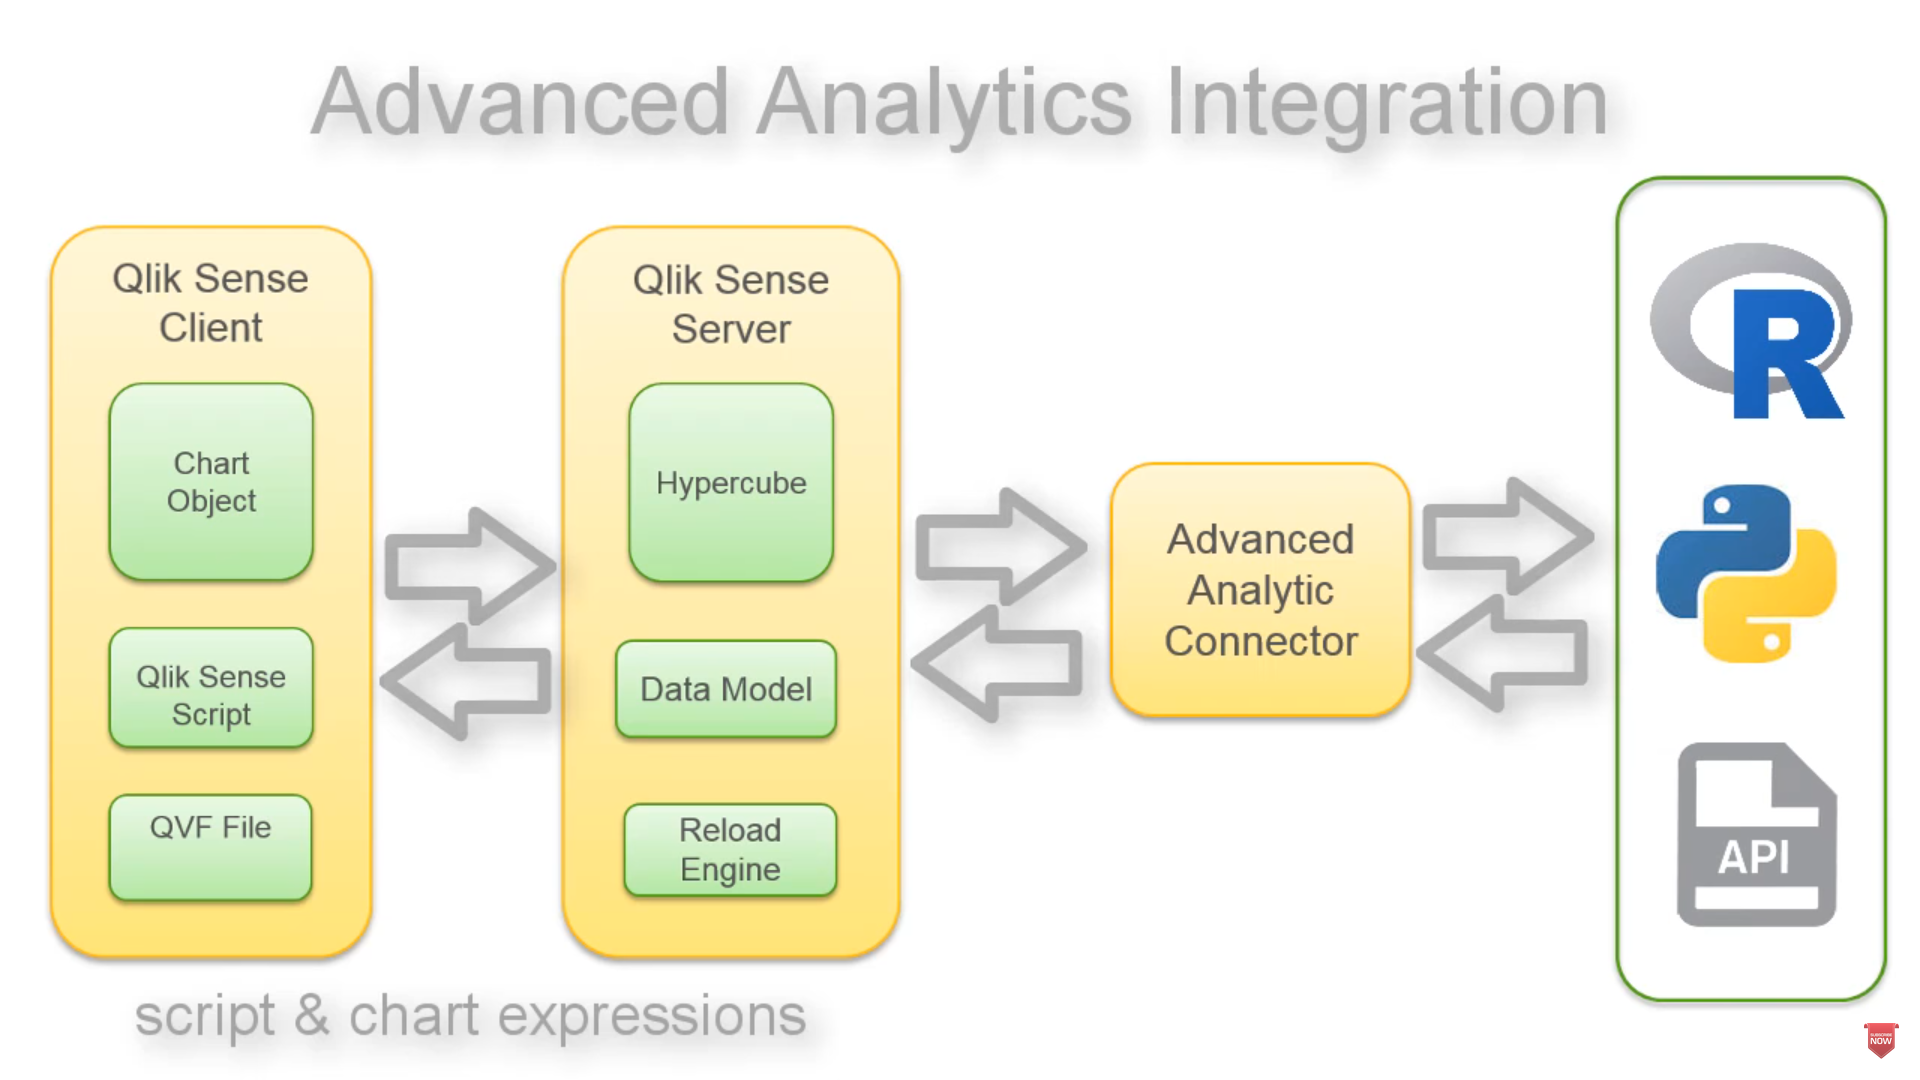
 

7-20-2017 5-40-37 PM.png

Architecture


Simply put, Qlik Advanced Analytics Integration (AAI) enables direct server to server data exchange between Qlik Sense and 3rd party calculation / analysis engines via a connector or what we also call a plugin. So for example, a specific forecasting function that is part of an R library can now be called from within Qlik script and chart expressions and calculated on the fly. Passing the results back to the Qlik analysis engine and subsequent visualizations.

aa1.gifi.e. - Holt-Winters Forecast / K-means Clustering - running on R


With the release of Qlik Sense June 2017, Qlik specifically now supports the APIs that can provide connectivity to such engines. Allowing you to build virtually any connector to any system. The Qlik Sense engine is also now aware of specific expressions to directly call the 3rd party engine via these connectors. To kick things off we have provided two open source connector projects that enable connectivity to R and Python. (there are compiled binaries for R available here)


To learn more about Qlik Advanced Analytics Integration, join the conversation and obtain resources and community support please visit the Server Side Extensions forum.


Take a look at this 60 second video that provides a quick overview of Qlik Advanced Analytics Integration:


NOTE: To increase resolution or size of the video, select the YouTube logo at the bottom right of the player. You will be brought directly to YouTube where you can increase the resolution and size of the player window. Look for the 'settings' gears icon in the lower right of the player once at YouTube.


Regards,

Michael Tarallo (@mtarallo) | Twitter

Qlik


Can't see the video?


Download the .mp4 and watch from your computer or mobile device.

25 Comments
Michael_Tarallo
Employee
Employee

Nice!

0 Likes
12,684 Views
Michael_Tarallo
Employee
Employee

Hi Garrett - with Desktop - there is the settings.ini file - that you can edit with the 3rd party Server information?

As an example - this is mine BUT - this is for a slightly older version of Advanced Analytics Integration:

[Settings 7]

EnableSSEgRPC=1

SSEPlugin=R,localhost:50051

With the Qlik Sense Enterprise server version - the settings.ini file located in the: C:\ProgramData\Qlik\Sense\Engine - directory is updated via the QMC now.

Hope this helps

Mike T

0 Likes
12,684 Views
sumit6191
Partner - Contributor

Hi Michael,

How does these functions work,since there is no R function inside ScriptAggr() and ScriptAggrStr()

1.R.ScriptAggr('q$pclass[1];' ,pclass, survived)

2. R.ScriptAggrStr('q$sex[1];' ,age_b, sex)  ?

0 Likes
12,687 Views
Anonymous
Not applicable

Hi Sumit,

I believe that you would need to install R on the desktop or PC that you'd be working with.  ...R is totally free and easy to install.  If interested (https://cran.r-project.org/)  ...The Advanced Analytics connector would then call it for execution, and the data would be returned to Qlik Sense from there (as shown in Mike's diagram above).

Anyway, it's I'm very interested in, since it could facilitate a lot of the great functionality of R (which I've always thought would compliment Qlik very well).

0 Likes
12,687 Views
sumit6191
Partner - Contributor

Hi Garrett,

Thanks for your precious time but i already did that and it's working fine.

when I wrote

q[670,c("pclass","survived")] in R. I'm getting output in my console

        pclass survived

670          3             0

and when i wrote above function in Qlik Sense KPI i.e.

R.ScriptAggr('q$pclass[670];' ,pclass, survived)

I'm getting output:

2 in my KPI chart object.

Why is that ?

0 Likes
12,687 Views
nikikoradia
Contributor II
Contributor II

Hey Michael, did you hear back from your internal team on opening up the Advanced Analytics Integration forum to the general audience? Hoping you come back with a yes!

0 Likes
12,687 Views
Michael_Tarallo
Employee
Employee

I am told this will be resolved this week! Fingers crossed!

12,687 Views
Anonymous
Not applicable

SUMIT KUMAR SINGH wrote:

Hi Garrett,

Thanks for your precious time but i already did that and it's working fine.

when I wrote

q[670,c("pclass","survived")] in R. I'm getting output in my console

        pclass survived

670          3             0

and when i wrote above function in Qlik Sense KPI i.e.

R.ScriptAggr('q$pclass[670];' ,pclass, survived)

I'm getting output:

2 in my KPI chart object.

Why is that ?

Sumit – I suspect Qlik may be sorting the q data frame before it passes it to R. The exact behavior of the ScriptAggr function is unclear to me, but if you replace the survived dimension with ID, the KPI chart object will display the correct value. I suspect this is because ID is numbered according to the original order of the data from the csv file.

R.ScriptAggr('q$pclass[670];', pclass, ID)

>> 3

Also note that if you were to remove the second parameter and just leave pclass as the sole parameter that you are passing to R, then it treats pclass as a dimension and passes a data frame with only three rows (the three distinct values of pclass. This is demonstrated by the example below:


R.ScriptAggr('sum(q$pclass);', pclass)

>> 6

Compared to...

R.ScriptAggr('sum(q$pclass);', pclass, ID)

>> 3004

12,687 Views
Anonymous
Not applicable

SUMIT KUMAR SINGH wrote:

Hi Michael,

How does these functions work,since there is no R function inside ScriptAggr() and ScriptAggrStr()

1.R.ScriptAggr('q$pclass[1];' ,pclass, survived)

2. R.ScriptAggrStr('q$sex[1];' ,age_b, sex)  ?

Just to clarify, the script q$pclass[1] is valid R code. The square brackets represent an indexing operator in the R language which, at its core, is an R function. For instance, the operation x[1] could be rewritten as `[`(x, 1), where [ is the name of the function. For that matter, the $ is another indexing operator that retrieves the pclass vector from the data frame q that Qlik passes to your running R session, and is similarly an alias for the underlying indexing function.

0 Likes
12,572 Views
sumit6191
Partner - Contributor

Hi Michael,

Thanks for your support, i think the same too that Qlik is sorting the q data frame before passing to R.

It would be great if Qlik clarifies how does these function work properly.

Regards,

Sumit

0 Likes
12,572 Views