Unlock a world of possibilities! Login now and discover the exclusive benefits awaiting you.
- Subscribe to RSS Feed
- Mark as New
- Mark as Read
- Bookmark
- Subscribe
- Printer Friendly Page
- Report Inappropriate Content
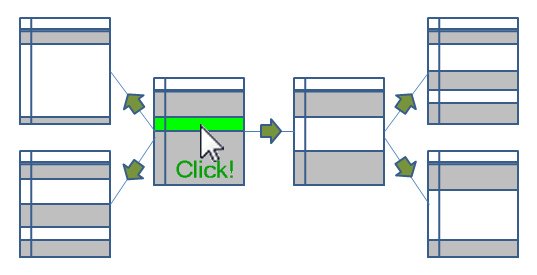
Every time you click, the Qlik engine recalculates everything.
Everything.
A new selection implies a new situation: Other field values than before are possible; other summations need to be made; the charts and the KPIs get other values than before. The state vectors and the objects are invalidated. Everything needs to be recalculated since this is what the user demands.
Well, there is of course a cache also – so that the Qlik engine doesn’t have to recalculate something which has been calculated before. So it isn’t quite true that everything is recalculated: If a calculation has been made before, the result is simply fetched from the cache. But it is true that nothing is pre-calculated. There is no need for that. Everything can be done in real-time.
The Qlik engine is an on-demand calculation engine.
From a principal point, there are two steps in the recalculation of data: The logical inference in the data model, and the calculations of all objects, including sheet labels and alerts.
The logical inference is done first. The goal is to figure out which field values in the symbol tables are possible and which records in the data tables are possible, given the new selection. There is no number crunching involved - it is a purely logical process. The result is stored in the state vectors.
Think of it as if the selection propagates from one table in the data model to all other tables. Table after table is evaluated and the Qlik engine figures out which values and records are possible, and which are excluded.
When the logical inference is done, the Qlik engine starts to evaluate all exposed objects. List boxes and dimensions in charts must be populated and sorted. All expressions – in charts, in text boxes, in labels, in alerts – must be calculated. Objects that are on other sheets, minimized or hidden, are however not calculated.
The calculations are always aggregations based on the data records that have been marked as possible by the logical inference engine. I.e., the objects do not persist any data on their own.
The calculation phase is usually the phase that takes time – often over 90% of the response time is due to calculations. The calculations are asynchronous and multi-threaded on several levels: First of all, every object is calculated in its own thread. Secondly, in the 64-bit version, many aggregations e.g. Sum() are calculated using several threads, so that a sum in one single object can be calculated quickly using several CPUs.
Finally, when an object has been calculated, it is rendered. Since the calculation is asynchronous and multi-threaded, some objects are rendered long before other objects are ready.
And when an object has been rendered, you can click again. And everything is repeated.
PS. All of the above is of course true for both QlikView and Qlik Sense. Both use the same engine.
If you want to read more about the Qlik engine internals, see
Symbol Tables and Bit-Stuffed Pointers
- « Previous
-
- 1
- 2
- Next »
You must be a registered user to add a comment. If you've already registered, sign in. Otherwise, register and sign in.