Unlock a world of possibilities! Login now and discover the exclusive benefits awaiting you.
- Subscribe to RSS Feed
- Mark as New
- Mark as Read
- Bookmark
- Subscribe
- Printer Friendly Page
- Report Inappropriate Content
NULL is not a value. It is a lack of value. It is a placeholder that marks nothingness.
So, how does QlikView show the concept of nothing – when this is the relevant answer to the user’s click?
To investigate this, I will use a hypothetical database with two tables: Customers and Orders. The Customers table is a list of customers, and the Orders table is a list of orders that these customers have placed.
List boxes
In the picture below, you have a selection of two customers that haven’t placed any orders, i.e. they exist in the Customers table but there are no corresponding records in the Orders table. As a result, all values in the OrderID list box are gray.
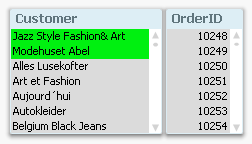
In other words; for a list box, it is simple: NULL is not visible as an explicit list box entry. If all entries are marked as gray, then the empty set is the answer to the click, i.e. NULL is the answer.
If you have a list box where you have a visible entry that is blank; that you can click on; that can be selected, then it is not a NULL. NULLs are never visible in list boxes and can never be selected. Instead, you have an empty string or some kind of white space.
Table boxes
In a table box, as well as in all other places where a NULL can occur, e.g. labels, text boxes, buttons, etc., NULLs are displayed as dashes. In these places, NULL is visible but not selectable.
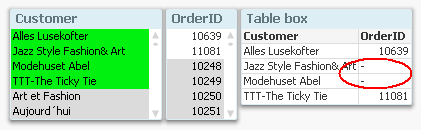
Chart dimensions
For a chart, it becomes more complicated. First of all, a NULL can occur either as a dimensional value or in the measure - the expression. These are two very different cases and should not be confused. Further, the two cases are managed in two different places in the chart properties.
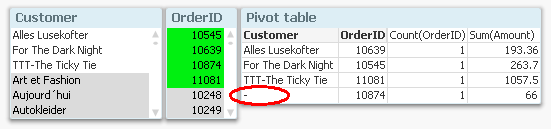
With the above data, it would be reasonable to make a chart that shows sales per customer. If there are orders that are not attributed to any customer, then you will get a NULL in the dimension of the chart – a NULL which is displayed as a dash. Below you can see that order nr 10874 has no customer associated:
If you don’t want to show lines with NULLs in the dimension, you can suppress these on the Dimensions tab in the chart properties.
Chart measures
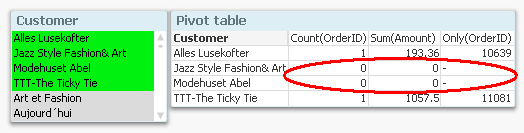
If your data is the other way around, i.e. you have customers that are not attributed to any orders, you will for these get NULLs in OrderID and Amount. However, the Sum() and Count() functions still return zero, which is correct, since Sum(NULL) is zero. Other aggregation functions such as Only() may return NULL, though, and this will be displayed as a dash.
If you don’t want to show lines with zeros or NULLs as expression value, you can suppress these on the Presentations tab in the chart properties.
So, the bottom line is that NULLs are sometimes visible, sometimes not. Sometimes they are displayed as dashes, and when aggregated, usually as zeros. But they are never selectable.
And with this, I hope that the mystery around NULLs is somewhat less of a mystery.
PS. In this blog post, I use “NULL” to denote both real NULLs and missing values. What the difference is? Read this (updated) white paper and find out. There you can also read about how to make NULLs both visible and selectable.
You must be a registered user to add a comment. If you've already registered, sign in. Otherwise, register and sign in.