Unlock a world of possibilities! Login now and discover the exclusive benefits awaiting you.
- Subscribe to RSS Feed
- Mark as New
- Mark as Read
- Bookmark
- Subscribe
- Printer Friendly Page
- Report Inappropriate Content
This is a function that enables the app developer to create nested aggregations, i.e. aggregations in two steps. Essentially the Aggr() is a For-Next loop where each loop contains a measure calculation. When all loops have been performed, a final aggregation based on the array of calculated measures can be made.
If we, for instance, want to calculate the monthly product sales, we could do it by using
Aggr( Sum(Sales), ProductName, OrderMonth )
This will produce a virtual table that looks like
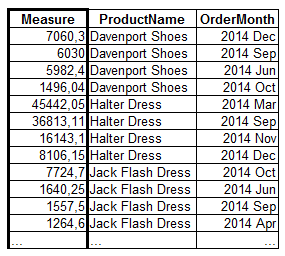
Note that there is exactly one row per distinct combination of the two dimensions.
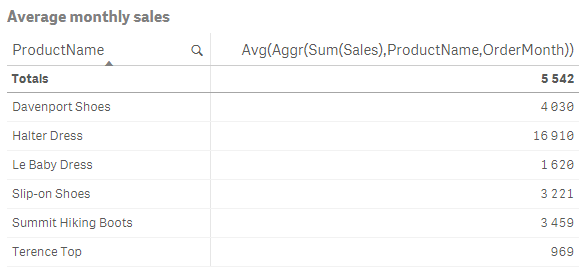
So, the Aggr() function creates a virtual table; an array of values that need to be aggregated in a second step. Hence you should wrap the Aggr() in an outer aggregation function. For instance, if you want to use the above table to calculate the average monthly sales, you should use
Avg( Aggr( Sum(Sales), ProductName, OrderMonth ))
With this mental picture of how the function works, we can start looking at the pitfalls.
1. Missing inner aggregation function
The first parameter of the Aggr() is a measure, and as such it is always an aggregation. Hence, you should use an aggregation function. If you don’t, the calculation will use Only() and the virtual table may inadvertently get NULLs in the Measure column. See more on Use Aggregation Functions!
2. Missing outer aggregation function
The outer aggregation function is needed whenever Aggr() returns more than one value. If no aggregation function is specified, Only() will be used, which may cause your chart measure to contain NULLs.
Note the totals line in the chart above: It shows the average over both products and months. Generally, totals will always be NULL if the outer aggregation is omitted.
3. Missing Set Analysis expression
So, there are both inner and outer aggregation functions. Where do I put my Set Analysis expression?
The answer is often “In both”. It may not be enough to have it in only one of the levels.
The current selection (or the relevant selection state) will always affect the aggregation scope of an aggregation function, unless you specify otherwise using Set Analysis. So, if you need Set Analysis you should in most cases have similar or identical Set Analysis expressions in both the inner and outer aggregation function.
4. Grain mismatch
When an Aggr() is used in a chart, you have inner dimensions in the Aggr() and outer dimensions in the chart. Then it is important that these match.
The grain of the Aggr() dimensions must be identical or finer than that of the chart dimensions.
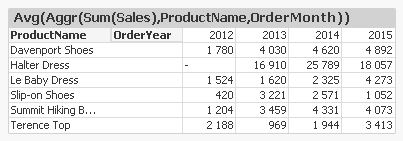
For example, an Aggr() with Month as dimension can be put in a chart that has Year as dimension. In the following table, the average monthly sales numbers are correctly calculated, and displayed as an average per year and product.
But the opposite isn’t necessarily possible. If you put an Aggr() with Year as dimension in a chart with Month as dimension, you will get problems. You may get a table that looks like this:
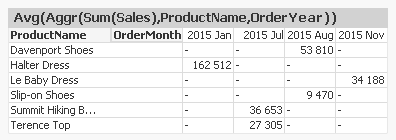
Here, the Aggr() function has produced one number per product and year, and this number has been assigned to one single month while the other months contain NULL. This is a result of the grain mismatch and most likely not what you want.
With this, I hope that you have a better understanding of Aggr().
Further reading related to this topic:
- « Previous
- Next »
You must be a registered user to add a comment. If you've already registered, sign in. Otherwise, register and sign in.