Yianni_Ververis
Employee
Employee

We have been adding more features to our qdt-components and some of these, are the latest Picasso.js charts.


Here are the charts that we have so far.

Also you can interact with them live on our react template, https://webapps.qlik.com/qdt-components/react/index.html


  1. You can Embed any object from Qlik Sense and the Capability API
  2. You can create any custom Session object by defining your own definition properties like dimension, measures, title, subtitle, color, order etc
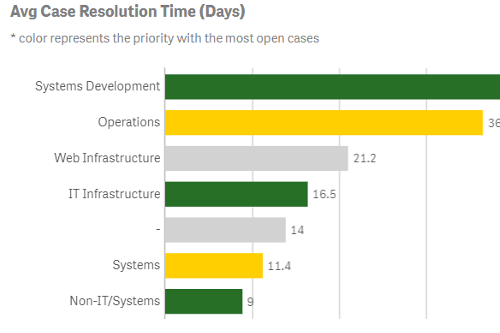
    embedded.png
  3. There is a custom Selection Toolbar that we use extensively in our mashups
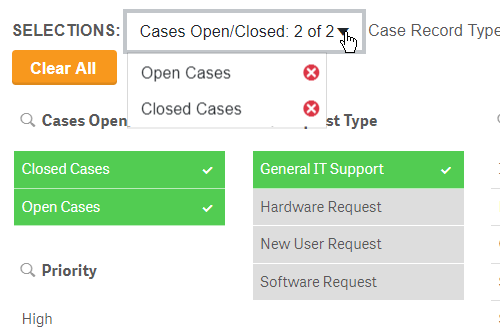
    selectionToolbar.png
  4. A Picasso Horizontal bar that detects the height of the div. Once The bars exceed that, it adds a scrollbar. It also features multiple selections and tooltip
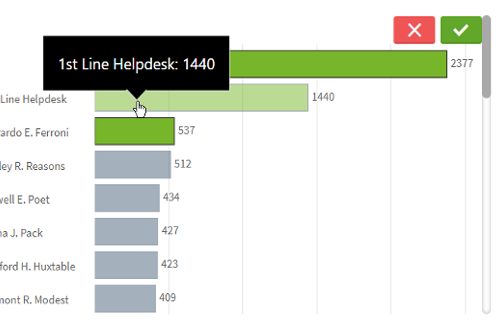
    picassoHorizontalBarchart.png
  5. The same idea but with vertical bars
    picassoVerticalBarchart.png
  6. A new Picasso Pie Chart with Legend, multiple selections and tooltip
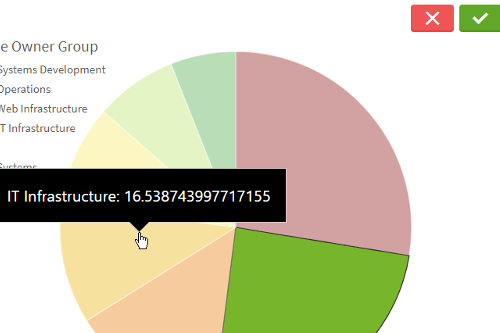
    picassoPie.png
  7. A new Scotterplot with multiple selections, tooltip and legend
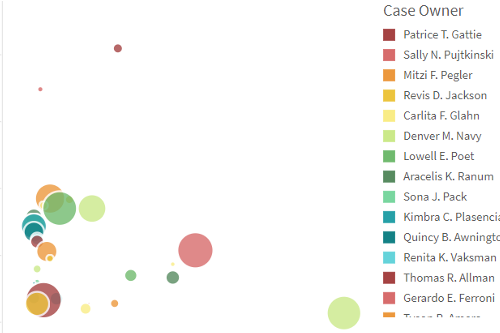
    picassoScotterplot.png
  8. And now the latest addition, scotterplot with custom images
    picassoScotterplotImages.png
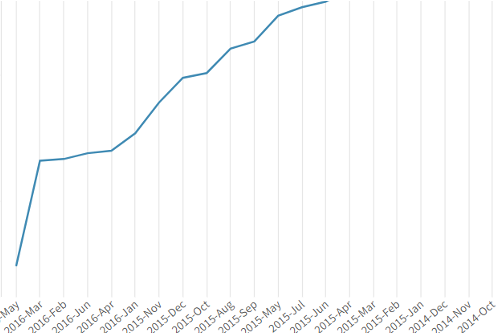
  9. A simple line chart
    picassoLinechart.png

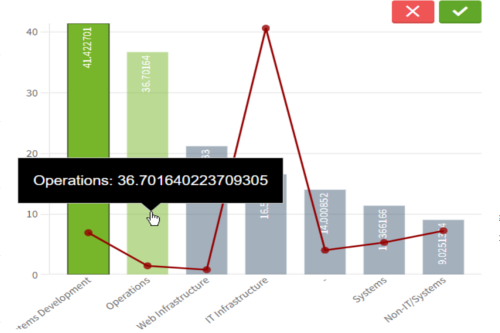
10. Combo chart

picassoCombochart.png


More are coming soon with this amazing library!!!!


Yianni

11 Comments
ananyaghosh
Creator III
Creator III

This library will by default be added with Qlik Sense installation? or it will be available through an extension?

Thank,

Sandip Ghosh

0 Likes
2,363 Views
Yianni_Ververis
Employee
Employee

Hello Sandip,

No this library is for mashups only. Eventually we will make it work as an extension too, but not now.

0 Likes
2,363 Views
Yianni_Ververis
Employee
Employee

Added a combo chart

picassoCombochart.png

0 Likes
2,363 Views
Yianni_Ververis
Employee
Employee
0 Likes
2,363 Views
ananyaghosh
Creator III
Creator III

hi,

It is great work. But it would be good if we can change the Font Styling of Chart Title, Axix Text(both Dimension and expression ) and need to show the tool tips on hovering on chart lines.

Thanks,

Sandip

0 Likes
2,363 Views
Yianni_Ververis
Employee
Employee
0 Likes
2,363 Views
Yianni_Ververis
Employee
Employee
0 Likes
2,030 Views
Anonymous
Not applicable

@jvs

Qlik Core doesn't have qlik.js and  qlik-style.css but Qdt-components refers qlik.js and qlik-style.css when we connect to qlik-core.

How to get rid of this situation to resolve those file not found issue.

0 Likes
2,030 Views
Yianni_Ververis
Employee
Employee

You just set the VizApi to false

0 Likes
2,030 Views
jeffersonshibuya
Partner - Contributor

Hi @Yianni_Ververis 

the stacked barchart tooltip is showing the sum values, instead of the current values for that dimension.  (https://qdt-apps.qlik.com/qdt-components/react/#/stacked-barchart

Do you know if there is a way to around this and show the values belongs to each dimension?

jeffersonshibuya_0-1589814053581.png

Thanks,

0 Likes
933 Views