Unlock a world of possibilities! Login now and discover the exclusive benefits awaiting you.
- Qlik Community
- :
- Discover
- :
- Blogs
- :
- Product
- :
- Design
- :
- Qlik Sense® Charts, from your personal Cloud to ev...
- Subscribe to RSS Feed
- Mark as New
- Mark as Read
- Bookmark
- Subscribe
- Printer Friendly Page
- Report Inappropriate Content
Have you already heard about Qlik Sense Cloud?
Borrowing the marketing jargon we could define Qlik Sense Cloud as a place to “create and interact with Qlik Sense apps whenever the need arises. Invite others to do the same in a secure environment. Explore data deeply, reveal connections instantly and see opportunities.”
That means you can create and share an app in the Cloud, work collaboratively with up to 5 peers, editing, creating new charts, or even uploading some more data, just as you are used to with Qlik Sense. But it also means an extraordinary opportunity. Qlik Sense Charts is a chance for us to share data insights with everybody, everywhere. The way it works couldn't be more simple, let’s check it out.
- Create your own app.
If you already have an interesting app you want to share you could use it by simply uploading it into the Qlik Sense® Cloud, otherwise you can create your app from the Qlik Sense® Cloud. - Create a chart you would like to share.
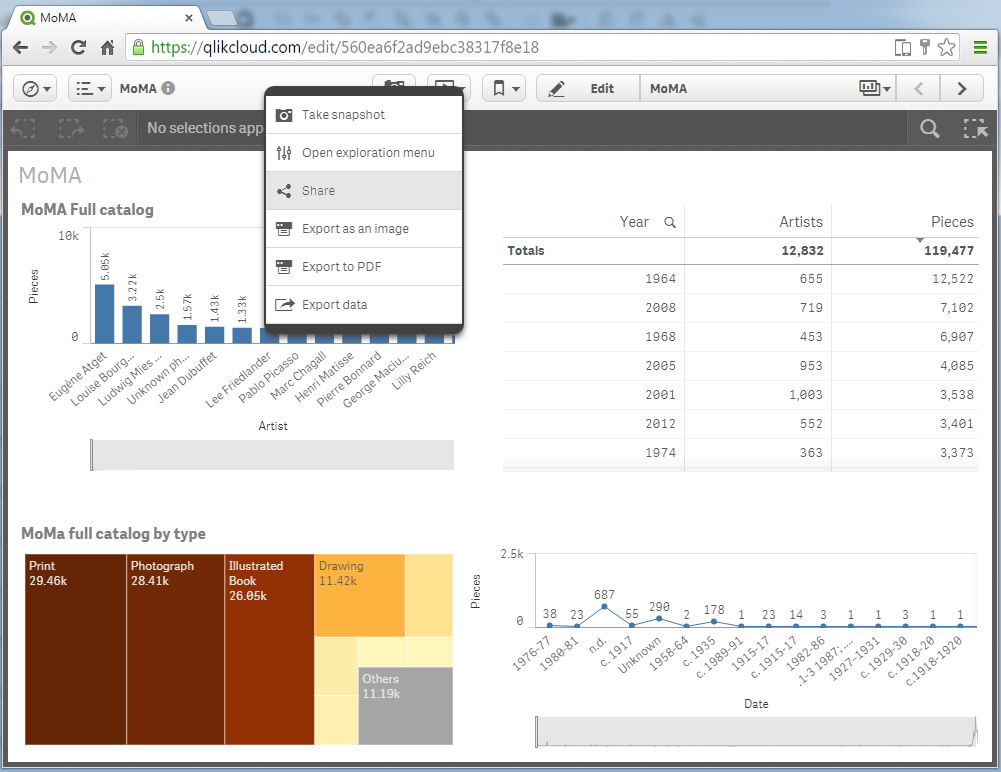
Create your chart or reuse one you already created, adjust sorting, colors, and all the attributes you would like to set up prior to sharing it. - Share it!
Right click on the chart* and click on share. You will get a popup with the URL to share the chart in your favorite social network or send via email, and also an Embed URL code that will help you place it in your web publication, online magazine, blog post, etc.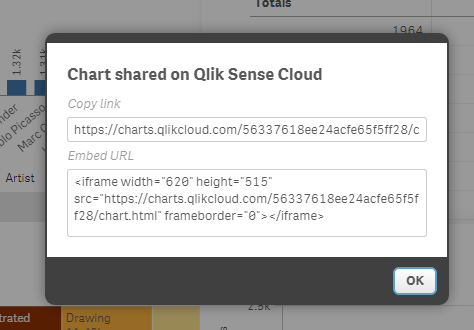
If you are curious to see how Qlik Charts looks like and you want to see the charts live please check out the following links:
Single Chart: Qlik Sense Charts: Visualizing MoMA art pieces by Artist
Embeded Chart: (Spanish language) Los puntos negros de las multas de estacionamiento: 114 millones de euros en un año | Madrid | EL MU...
Enjoy sharing!
AMZ
*At this point we could share Bar charts, Line charts, Combo charts, Gauges, Maps, Scatter charts, and Treemaps.
You must be a registered user to add a comment. If you've already registered, sign in. Otherwise, register and sign in.