Unlock a world of possibilities! Login now and discover the exclusive benefits awaiting you.
- Subscribe to RSS Feed
- Mark as New
- Mark as Read
- Bookmark
- Subscribe
- Printer Friendly Page
- Report Inappropriate Content
What is a histogram? A histogram is a chart that allows you to visualize the distribution of data over a continuous interval or certain period. It is made up of bars like a bar chart but instead of displaying actual counts against a dimension, a histogram displays the frequency at each interval or bin allowing you to see where the values are concentrated and where there are gaps or odd values. A histogram is also different from a bar chart in that it does not need measures. Only a single numeric dimension is needed to create a histogram. Once the dimension is added to the Qlik Sense histogram chart, the frequency is automatically calculated.
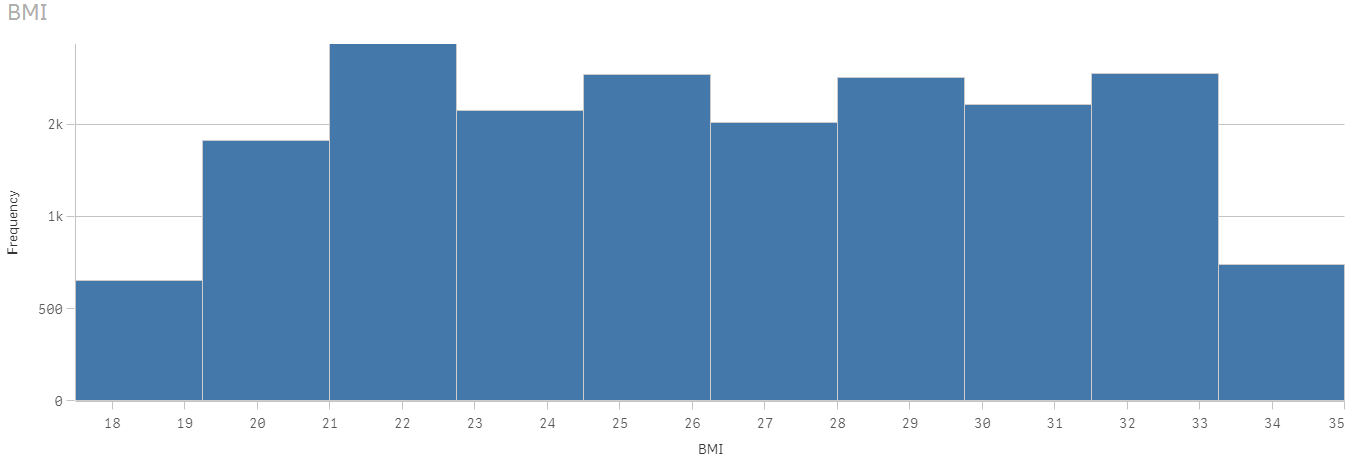
Let’s look at an example, in the histogram below, the dimension BMI (body mass index) is used to view the frequency. After BMI was added to the chart, Qlik Sense automatically created the BMI bins based on the frequency distribution. This chart shows that BMI is concentrated in the range 21 <= x < 22.75 (21 to 22.75, but not including 22.75).

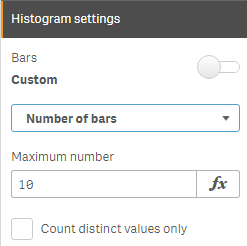
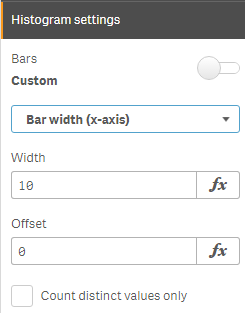
The Qlik Sense histogram chart has some properties that can be used to customize the histogram. There is the ability to set the number of bars to a maximum number or set the width of the bars if you would like the bars to be even intervals. Qlik Sense Help has an example of a histogram using even intervals to show temperature.


In the histogram above, the number of bars is set to 10. When the bars are set to Auto, Sturges’ formula is used to determine the bins and this may change based on selections.
A histogram chart is ideal for a large amount of data when you need a quick visualization of frequency. It is easy to create since only one dimension is required. The key to remember is that the dimension field must be numeric. Try it out with your numeric dimensions in your next Qlik Sense app. If you are using QlikView, you may be interested in Henric Cronström’s blog Recipe for a Histogram on how to create a histogram in QlikView. Also, check out Arturo Munoz’s blogs on the Distribution Plot chart and the Box Plot chart. You may also find these helpful in your next Qlik Sense app.
Thanks,
Jennell
- « Previous
-
- 1
- 2
- Next »
You must be a registered user to add a comment. If you've already registered, sign in. Otherwise, register and sign in.