Announcements
Qlik Connect 2024! Seize endless possibilities! LEARN MORE
hic
Former Employee
Former Employee

As most of you have noticed – I hope – we have now released a new product.

Qlik Sense.
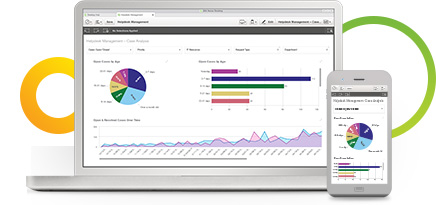
new_sense_overview-bottom_left.jpg

Qlik Sense is not just a new release of QlikView. Instead it is something different. But there are still so many similarities between the two products, so I thought it would be appropriate to dedicate a blog post to differences and similarities between the two.

Basically, the two products are two different user interfaces to the same analysis engine. This means that old scripts and old formulae will (almost) always work exactly the same way as before. (There are some smaller differences in that Qlik Sense uses libraries, and cannot always use relative paths for files.)

Hence, the two products both have the same Green-White-Gray logic; both use the same calculation engine; both have roughly the same response times; and you should use the same considerations for both when it comes to data modelling. This also means that many of the previous posts here on the Design Blog are just as relevant for Qlik Sense as for QlikView.

But the two products are still very different. And just as a parent cannot say that one child is better than the other, I cannot say that one product is better than the other. They are good at different things:

  • QlikView is a tool for situations where you want prepared business applications, i.e. applications created by developers who put a lot of thought into the data model, the layout, the charts and the formulae; and deliver the applications to end-users who consume the applications. We call this Guided Analytics. The end-user has total freedom to explore data, select, drill down and navigate in the information, and can this way discover both questions and answers in the data. The end-user is however limited when it comes to creating new visualizations. This type of situation will without doubt be common for many, many years to come.
  • Qlik Sense is a tool for situations where you don’t want to pre-can so much. Instead you want the user to have the freedom to create a layout of his own and in it, new visualizations; charts that the developer couldn’t imagine that the user wants to see. You want Self-service data discovery, which means a much more active, modern, engaged user. In addition, Qlik Sense is much easier to use when you have a touch screen, and is adaptive to different screen sizes and form factors. On the whole, Qlik Sense is a much more modern tool.

Finally, it is important to acknowledge that a piece of software is never ready. It evolves constantly:

Qlik Sense today is only the first version of something that will evolve further and get more features and functions as time goes on. Some of the features and functions of QlikView have not yet been implemented in Qlik Sense – there just hasn’t been time enough – but many of them will be implemented in coming versions.

Also QlikView is not yet a "final product". The product will be developed further, and most likely we will see some of the new functionality from Qlik Sense also in coming versions of QlikView. The goal is to use the same platform for both user interfaces.

With these two tools, we believe that we are well prepared for the future.

HIC

90 Comments
zagzebski
Creator
Creator

RJ - I am new to Sense. In fact haven't really even explored. However a company I do work for just purchased it. A few questions if you don't mind:

1. I keep hearing that a limitation of View is the "Guided Analytics"-only part. My experience with View is that the users can pretty much create what they want (albeit more cumbersome than Sense). In fact I have users to very opwerful things on the front end. Why does it keep getting represented that View users can't create their own analytics. Or is it just a matter of the technical expertise has to be much greater for View?

2.  When start the process of moving my model from View to Sense is at as simple (from the model only persepctive) as copying over my script? Are connections simple to understand? Is the scripting language basically the same?

3. On the front end is Sense as robust as View (aggragations, set analysis, triggers, variables, etc.?)

Thanks for any advice (and sorry for all the questions)

Steve

0 Likes
993 Views
hic
Former Employee
Former Employee
  1. It is certainly possible also for QlikView users to create visualizations. But our experience is that most non-technical users think it is difficult, and so QlikView is de-facto mostly used for "Guided Analytics".
  2. It should be straightforward. The scripting language is basically the same, although there are some minor differences. (E.g. absolute paths are not possible in Qlik Sense.) Just drop your qvw in the Sense app folder, then open the app.
  3. Both product use the same engine, so most things are just as robust:
    1. Aggregations and Set Analysis: Yes!
    2. Triggers, Macros and Actions: Not implemented.
    3. Variables: Only partly exposed. Variables need to be defined in the script and can be used in some, but not all places.

HIC

993 Views
zagzebski
Creator
Creator

Thanks Henric. Very helpful.

Steve

0 Likes
993 Views
vadimtsushko
Partner - Creator III

In Qlik Sense you cannot define a measure name using an expression.

For example:

Bar chart with one dimension (Region) and two measures (Sales Today, and Sales Yesterday).

In the measure expressions you will most likely use set analysis to calculate sales for "today" and "yesterday". In the legend and/or the tooltip on hovering over a bar you may want to see the measure name defined as "Sales 7th July" and "Sales 6th July" rather than "Sales Today" and "Sales Yesterday". You can't do this as you cannot use an expression in the measure names.

More than this, if you want to allow users to flip between measures on a chart you might set up a data island with the measure name and measure expression.  The chart would evaluate the selected measure using $(Measure_Expresssion). You should be able to also evaluate the measure name using $(Meausre_Name) but you can't.

Huge limitation in my opinion.

Hi, Jason.

I've tried to solve that particular problem in Qlik Sense. Can not say the result is fully satisfying for me, but maybe it would me of some interest to you anyway. Emulating dynamic labels in Qlik Sense

0 Likes
993 Views
Jason_Michaelides
Luminary Alumni
Luminary Alumni

Thanks - I'll take a look!

0 Likes
1,092 Views
Anonymous
Not applicable

Hi Henric,

Thank you for your post.
This article helped me a lot with my doubts about these two Qlik's products.

See you!

0 Likes
1,092 Views
amonjaras
Partner - Creator II

Hello Jason!

As of Qlik Sense 2.2, you can add alternate, user-selectable measures (and dimensions too) to a visualization.

Nice to see new functionality Is being constantly added.

1,092 Views
Not applicable

Helpful post. Thanks

0 Likes
1,092 Views
beck_bakytbek
Master
Master

Thanks a lot for this explanation, it is very useful to know, how does look the differences at once between QlikView und Qlik Sense

Thanks a lot

Beck

0 Likes
1,092 Views
jaume_soc
Contributor II
Contributor II

Great post Henric,

I have used both tools in two different companies. I currently used QlikSense in a small company that is evolving and changing every month so that the dashboard designed has to change and I can design our own special visualization. I totally agrre with your definition Self-service data discovery.

Just hope I will be able to do as many things with QlikSense as I could with QlikView.

0 Likes
1,092 Views