Announcements
Qlik Connect 2024! Seize endless possibilities! LEARN MORE
Jennell_McIntire
Employee
Employee

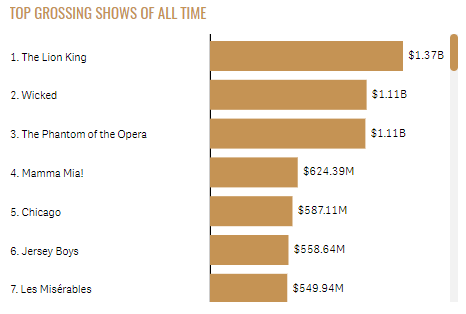
Over the years, I have seen the Rank function used in various expressions.  Recently, I was working on a Broadway Shows project where we wanted to show the rank in a bar chart before the label adding a numeric indicator of how a show ranked.  You can see what I am referring to in the bar charts used in the Broadway app.  The bar chart below is an example of one of the charts.  We added the rank before the show name on the y-axis label.
Broadway.png

In this blog, I will discuss how the Rank arguments can be used to change how the rank is presented.  To do so, I will use a simplified data set to illustrate how the rank can be displayed.  Let’s start by defining the Rank function.  The Rank function is a chart function and is defined in Qlik Sense Help as:


Rank() evaluates the rows of the chart in the expression, and for each row, displays the relative position of the value of the dimension evaluated in the expression. When evaluating the expression, the function compares the result with the result of the other rows containing the current column segment and returns the ranking of the current row within the segment.


For charts other than tables, the current column segment is defined as it appears in the chart's straight table equivalent.


Syntax:

Rank([TOTAL] expr[, mode[, fmt]])


Originally, I used the Rank function without any arguments.  This will rank the products by their sales and display it before the product label.

Rank no arguments.png

Rank no arguments chart.png

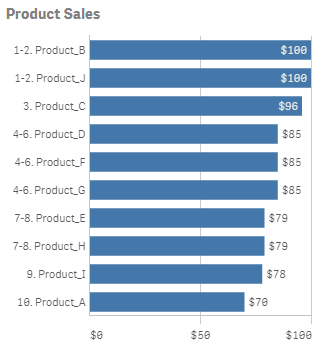
By default, with no arguments for mode and fmt, the Rank function will show the lowest and highest value displayed like a range as seen in the chart above.  But what if you want to show a single number for the rank where Product_B and Product_J would show 1 as the rank for both projects since they both tied for first place.  This can be accomplished by using the mode and fmt arguments.  Mode can take values 0 – 4 and controls which rank is shown for each row for example show the lowest rank, the average rank or the highest rank.  The fmt argument takes values 0 – 2 and controls how and where the rank is displayed.  You can find the detailed description for each setting in Qlik Sense Help.


For the Broadway app, I set the mode to 4 and the fmt to 1.  If I do this with this data set, I will get a chart like this:

Rank arguments.png

Rank arguments chart.png

The mode argument is 4. This will show the lowest rank on the first row, then increment by one for each row.  The fmt argument is 1 and this will show the low value on all rows.  When there is a tie, only the lowest rank will be displayed on the respective rows.


There are not always ties when using the Rank function but when there are, the Rank function provides options for how to handle the display of the rank.  This was something I never had a need for until now but I found it to be very valuable so I thought I would share what I have learned.  The next time you use the Rank function, try out the various arguments to find the display that works best for your app.


Thanks,

Jennell

20 Comments
paulyeo11
Master
Master

Hi Jennell

Thank you very much , I manage to get it now.

Paul Yeo

DIrector

TDS Technology (S) P/L

Whatsapp +65 9326 1804

www.tdstech.com<http://www.tdstech.com>

0 Likes
12,288 Views
paulyeo11
Master
Master

Hi Jennell

=Aggr(Rank(Sum(sales), 4, 1), BRAND_) & '. ' & BRAND_

For the above expression , kindly share with me how to add one condition for year = 2017 ?

My goal is to rank the current year TOP 10 customer sales.

Paul Yeo

DIrector

TDS Technology (S) P/L

Whatsapp +65 9326 1804

www.tdstech.com<http://www.tdstech.com>

0 Likes
12,288 Views
Jennell_McIntire
Employee
Employee

Hi Paul,

You would add that to your measure: sum({<year={'2017'}>} sales).  If the year value will change yearly, you should consider using a variable for the year so you do not have to update the measure as the data changes.

Jennell

0 Likes
12,225 Views
paulyeo11
Master
Master

Hi Jennell

Thank you very much , I apply the condition filter at both dimension it work fine.

In Qlik Sense it is not allow me to use variable , unless I use extension right ?

Or it there any other alternative , if I decide to make it dynamic on year.

Paul Yeo

DIrector

TDS Technology (S) P/L

Whatsapp +65 9326 1804

www.tdstech.com<http://www.tdstech.com>

0 Likes
12,225 Views
Jennell_McIntire
Employee
Employee

Paul,

Variables can be used in Qlik Sense with or without an extension.  I would recommend checking out Qlik Sense Help to learn how to create variables and use them.

Jennell

0 Likes
12,225 Views
paulyeo11
Master
Master

Hi Jennell

May be I mis-understand you.

https://community.qlik.com/message/1302511#1302511

I still unable figure out how to create a variable using Qlik Sense for make the tanking chart cam display YTD ranking & LYTD using one chart. ( In Qlik View I can use button with column dimension in load script ).

Hope you can share with me how to do it in QS ?

Paul Yeo

DIrector

TDS Technology (S) P/L

Whatsapp +65 9326 1804

www.tdstech.com<http://www.tdstech.com>

0 Likes
12,225 Views
Jennell_McIntire
Employee
Employee

Paul,

I misunderstood how you wanted to use the variable.  To use it in a button as you described currently needs to be done using an extension.

Jennell

0 Likes
12,225 Views
paulyeo11
Master
Master

Hi Jennell

Thank you very much for your reply.

May I know that since some of the extension is very popular , like variable , custom report which is very popular , may be one of these day , it is possible for your developer to add these extension at standard feature right ?

Paul Yeo

DIrector

TDS Technology (S) P/L

Whatsapp +65 9326 1804

www.tdstech.com<http://www.tdstech.com>

0 Likes
12,225 Views
stevedark
Partner Ambassador/MVP

Hi,

I've a requirement where we are trying to use rank to colour grouped values in a table. In this case we would want to give the same values the same rank (which happens fine), but then give the next value the next sequential value - not skip numbers, so you would have:

1,1000
2,750
2,750
3,600
3,600
4,250

So in this case with six rows, but four distinct results it should give four ranks and not six.

I may be barking up the wrong tree using rank (and the Odd function) to do the colour, but to my mind there should be a way of getting rank to behave in that way.

Steve

0 Likes
9,804 Views
sukantoB
Contributor II
Contributor II

Hi @Jennell_McIntire & Others,

Thanks for sharing this example, it was really helpful. I have been trying something similar, with the 'mode' argument, but I cant figure out what it really does in absense of a 'fmt' argument. I tried all the 4 options for this parameter, but everytime I get the same output

rank(TOTAL Created,1,)

rank(TOTAL Created,2,)

rank(TOTAL Created,3,)

rank(TOTAL Created,4,)

sukantoB_0-1613273582578.png

I am wondering how we can implement the option 4 i.e. 'Lowest rank on first row, then incremented by one for each row.'  In my example, I would like to replace the 2-4 rank values with 2,3,4, something like this below

sukantoB_1-1613273759074.png

Please let me know what am I missing here, and what can be done to achive this. 

Qlik Sense Business 

Regards

Sukanto Bhowmik

0 Likes
535 Views