Announcements
Qlik Connect 2024! Seize endless possibilities! LEARN MORE
ArturoMuñoz
Employee
Employee

It was Saturday 11:30 when my phone buzzed; I picked it out of my pocket and checked the message. “Hey, I’m running late. See you in 15 min“. At that time I was already in a bar packed with football fans wearing Messi or Ronaldo jerseys ready to watch one of the best games of the year. El Clásico, where the two best teams in the world, Real Madrid and Barcelona, go head-to-head.

With a few minutes to kill before the game kickoff I was browsing my Twitter (@arturoqv) timeline when I stumbled upon a link to the map below.Facebook Fandom.jpg

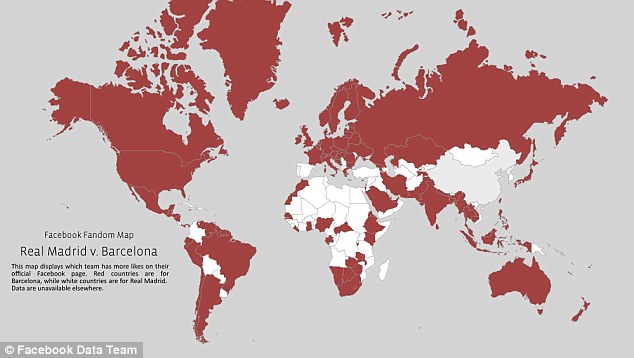
Facebook Fandom map.Displays which one of the two teams has more fans (likes) on their official Facebook page.

When I looked at the map, and despite having a pretty good idea of what to expect, it took me a while to understand what I was looking at. Where was the chart legend? After reading the text on the chart I finally understood that the red areas were for Barcelona while the white areas are for Real Madrid fans. It’s pretty clear that Barcelona has a lot more fans that Real Madrid, right?

Later when the game ended (congratulations to Real Madrid fans for such a great game and victory) I wanted to check the map again. This time I used my favorite search engine to find the map, it pointed me to an article from the Daily Mail. The article includes some facts in addition to the cited map, such as the total number of fans. Based on Facebook-likes data, Barcelona has more than 77 million fans while Real Madrid has a very close 75.5 million. Just 1.5 million people difference.

But, wait a minute that changes everything, right?

Why this map is poorly coded?

It seems clear that Facebook Data team aim was to illustrate fandom across the world in a binary and easy way by comparing just two numbers, Barcelona and Real Madrid number of fans, but is the visualization being truthful?

Well, I don’t think so. The data may be good but the information it contains is partial and is not giving the readers all the relevant data.

Based on the above map color code, you might think that Barcelona FC is by far more popular. When looking at the actual numbers; there are only 2% more Barça supporters than Real Madrid. The map doesn’t reflect at all that small difference; on the contrary it’s showing a huge distance between teams.

How to improve it?

Working with diverging gradient color scheme will show where the difference is more intense, where the gap is bigger.

In the map below we still can see how the forces are distributed across the countries, blue versus red, but this time using color intensity we can see how big the difference between the two teams is.

alteranative1.png

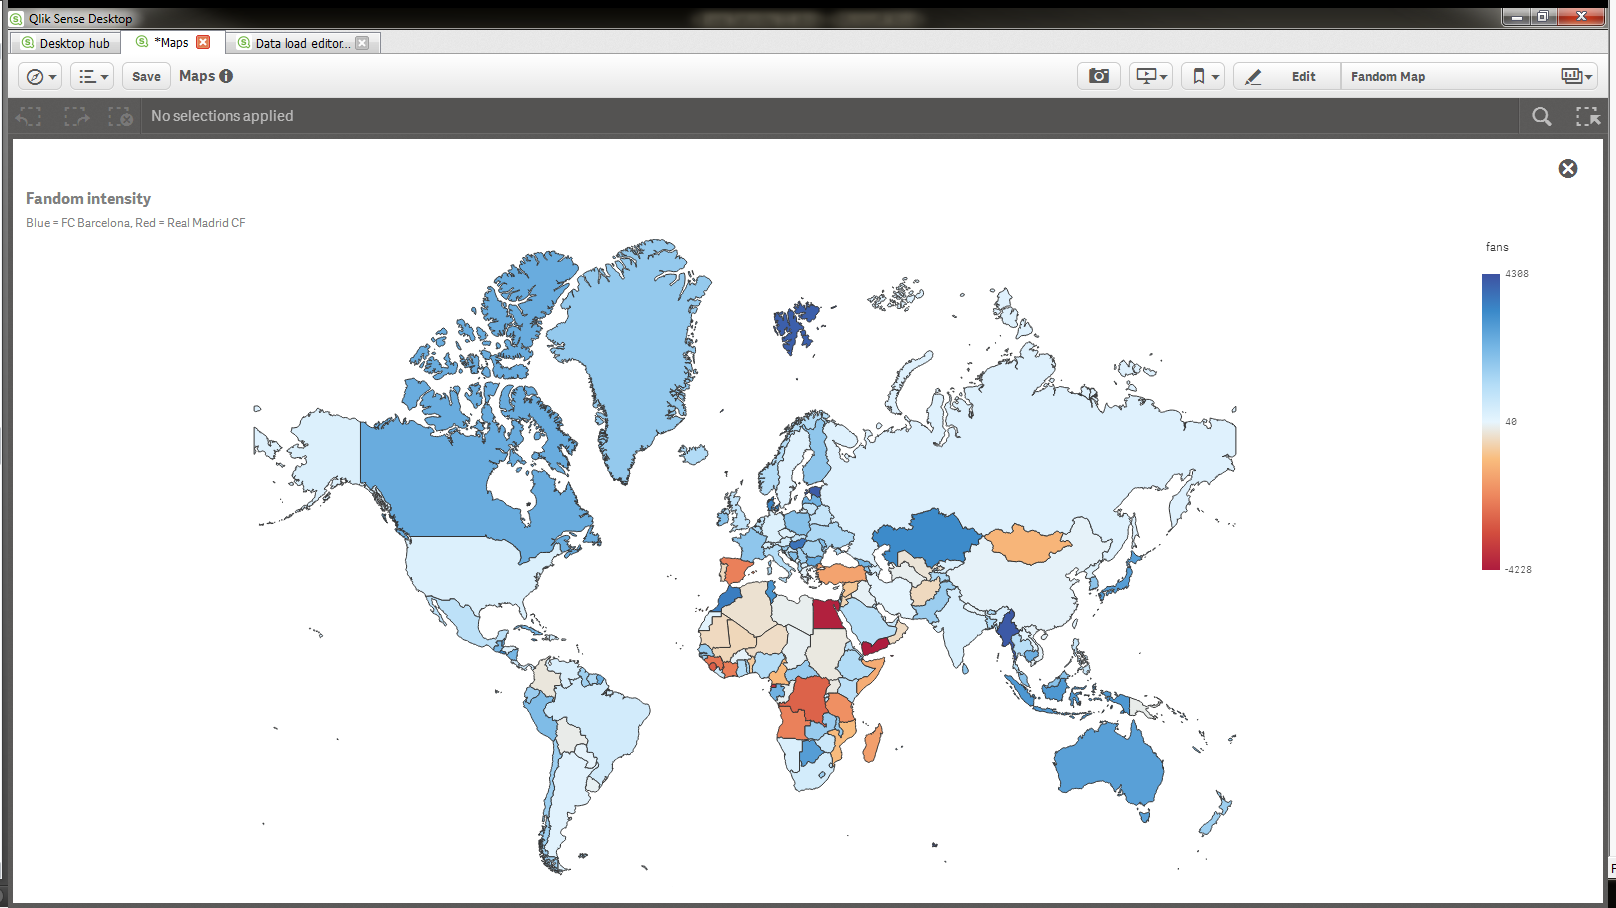
Unfortunately Facebook is not making their data available anywhere so I made up some fake data to illustrate my example

Adding more information layers

In terms of data density the map above is far more complete and truthful than the original one but the downside is that isn’t so obvious which team has more fans across the globe.

We could improve readers’ comprehension creating what I think is a better and more truthful experience.

alternative2.png

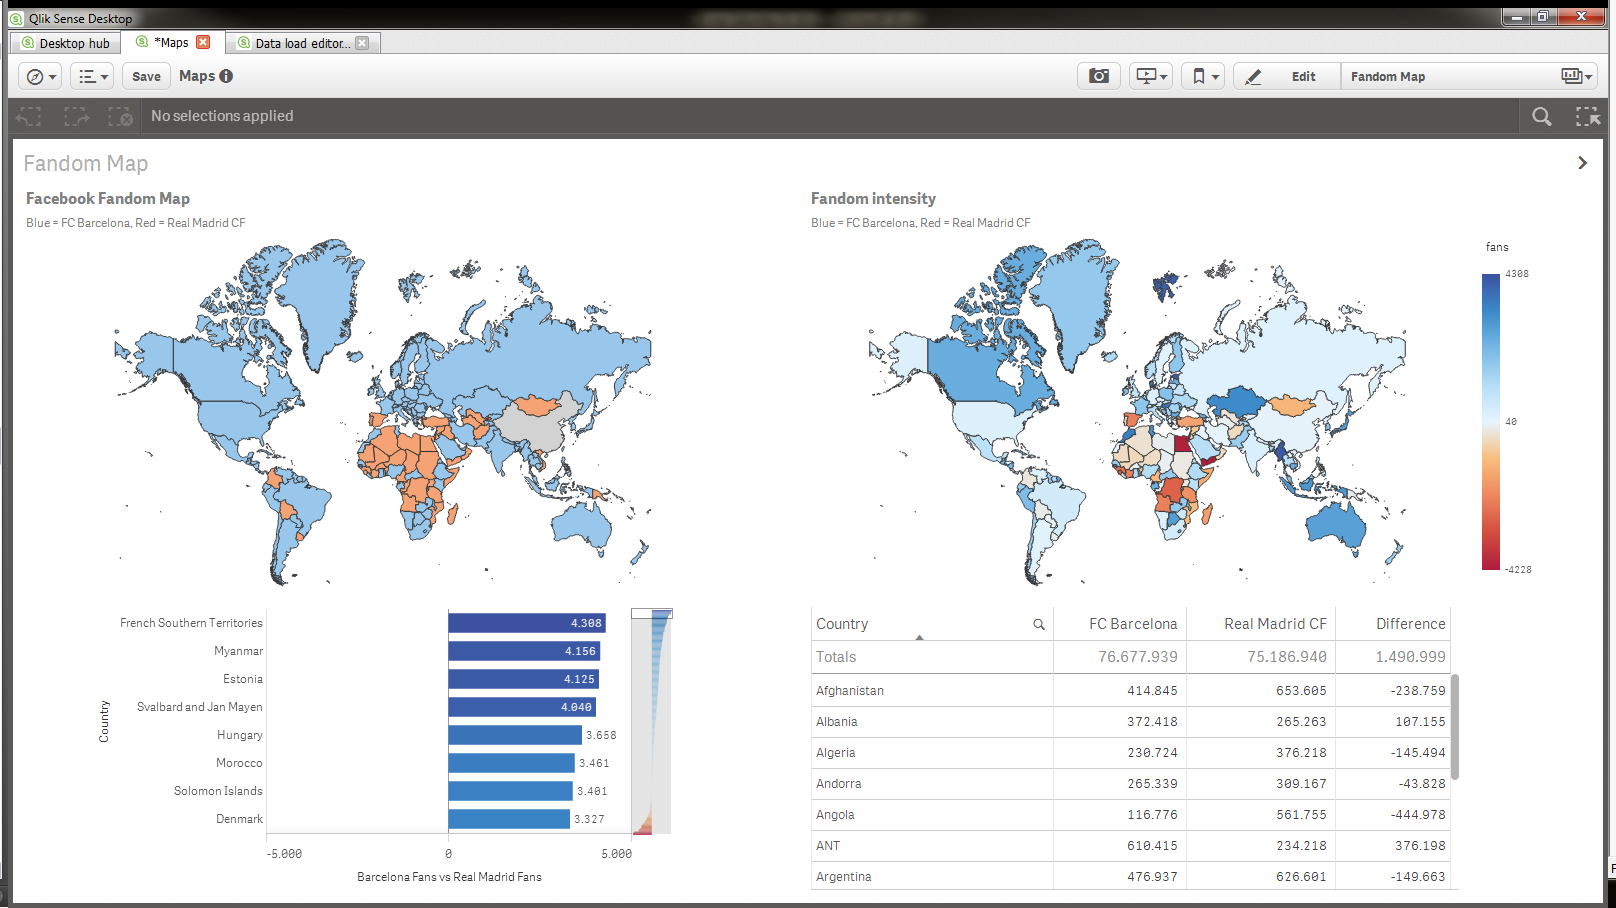
First we will create a map that will color the countries based on which team has more fans in it (top left chart) nothing new here, we are showing same information as in the original chart. Next we’ll add more information layers (objects) to our sheet. Fandom intensity chart on the top right corner shows not just where there are bluer fans but also it displays how big the gap is. To complete our alternative proposal we could add a couple of supporting charts; a bar chart that lets readers accurately see how big the gap is and compare countries, and a table for those number lovers in the audience.

I guess the bottom line of this story is, always show all the relevant and supportive data that will guide readers or users to better understand the facts.


Enjoy Qliking!

9 Comments
Marcio_Campestrini
Specialist
Specialist

Hi Arturo.

Thanks the post. It bring to us some clarifying information.

Márcio

1,968 Views
Alexander_Thor
Employee
Employee

Hey! I was only 4 minutes late! *grumbles*


Here is a pretty good flowchart on deciding between a map or a bar chart All sizes | MapOrNoMapFlowChart | Flickr - Photo Sharing!

1,968 Views
flipside
Partner - Specialist II

These are good examples of different ways of displaying data, however I'm not sure I agree that the original map is poorly coded as it does state that they have coloured the countries red or white depending on which team has the majority facebook likes, and we can further determine from it that Real have groups of majorities in African, Middle Eastern and South American countries. What is difficult to say is how many countries each club dominate in, because Barcelona have the upper hand in the larger area nations. However the map works as a reference if the intention is just to show which country has what value.

By using a diverging colour scheme we are answering a different question but I think it makes Real look worse off because it's difficult for the eye to see the difference in shades of light blue. I'd look at having a smaller colour index to show, say, 3 grades (Real dominant over x%, little difference, Barcelona dominant over x%) and link the x value to a variable to allow interaction.

flipside

1,968 Views
ArturoMuñoz
Employee
Employee

That's very interesting @flipside, is true that the map might be well suited to answer the question "What football club has more fans by country?". The problem, and this is why this visualization seems a bad choice to me, is the question itself. I don't think that question is fair enough to the readers especially when the difference is so little. The question is leading me to a wrong conclusion. As a reader I want more tools (layers, objects, charts) to understand how forces are distributed across the globe.

1,968 Views
ArturoMuñoz
Employee
Employee

About the Alex's point on deciding between a map or a bar chart, this is a good example in favor to maps. This time a map actually makes a lot of sense. By choosing a map to display this data we will let users to cluster areas based on proximity. We have a great example about it at @flipside comment:

"(...) and we can further determine from it that Real have groups of majorities in African, Middle Eastern and South American countries (...)"

0 Likes
1,968 Views
ogster1974
Partner - Master II
Partner - Master II

http://www.bbc.co.uk/news/business-29898083 An Interesting post.

I think its all about the story you are trying to tell rather than which types of charts look best.  Data can be twisted to support a number of views/positions.  Perhaps this view was exactly what the data journalist was looking to support his article. Although your chart is more detailed the user has to investigate more to understand what's going on. The Daily Mail is not a source I would go to if I was looking for an impartial view on anything but in general newspapers are looking for info graphics that are eye catching to draw the user to view the article.  In which case I would argue the original graphic is more enticing than yours.  Above is an interesting article from the BBC on how a set of figures from an independent source is being used for political ends. 

1,968 Views
ArturoMuñoz
Employee
Employee

Andy Weir wrote:

I think its all about the story you are trying to tell rather than which types of charts look best.  Data can be twisted to support a number of views/positions.  Perhaps this view was exactly what the data journalist was looking to support his article. (...)

Data can be twisted to support your view, that's true but it shouldn't. Charts are tools for people to better understand the data, to answer questions. Charts are not just nice graphic pieces to prove the journalist/developer point of view.

PS: About The Daily Mail reference in the post, that was my search engine please don't blame me . Anyway the number of Facebook fans in their official accounts is public info available to everyone. At this time FC Barcelona: 78,257,870 while Real Madrid CF: 76,771,450 still around 1.5M (<2%) difference.

0 Likes
1,546 Views
Anonymous
Not applicable

There is an interesting article around how to accurately display similar data which can be found here

Value-by-alpha maps | Andy Woodruff

I think that trying to show the relative sizes of the fan bases, rather than an absolute binary approach, is the right thing to explore. The simple blue vs red map is great for making a quick point on an Internet forum but for a more nuanced view of the data (e.g. to really understand it) you need another dimension to control the importance of each country to show through.

1,546 Views
ogster1974
Partner - Master II
Partner - Master II

Agreed Charting tools can be used for so much more than the base example. Your use of Qlik Sense to extend the view of the data to provide additional insight opened up more questions to be asked and answers.  What I was referring to is context or "the question" drives the appropriate visualisation and in this case the question is a narrow one.  The great thing about QlikView and Qlik Sense products is that it is a discovery tool so its about not just answering "the question" but the one after that and the one after that.

As to whether the original chart is true. I personally wouldn't attach ethics to the type of chart or the tool used.  We all make conscious or unconscious decisions to present data in a way that fits our view of the world. 

As long as you are not excluding required data i.e. You actually found in your research there were in fact more Real Madrid fans than Barcelona ones.  (After the 3-1 defeat in the latest el classico quite possible.  Man U fans need someone to support now they are not in the champions league )  then you can do what you like with it as long as you make it clear to the consumer of your chart its source and provide enough context (Titles, Labels, Legends etc...) for them to understand what they are being shown.

1,546 Views