hic
Former Employee
Former Employee

“Which products contribute to the first 80% of our turnover?”

This type of question is common in all types of business intelligence. I say “type of question” since it appears in many different forms: Sometimes it concerns products, but it can just as well concern any dimension, e.g. customer, supplier, sales person, etc. Further, here the question was about turnover, but it can just as well be e.g. number of support cases, or number of defect deliveries, etc.


QV Bar chart.png


It is called Pareto analysis or ABC analysis and I have already written a blog post on this topic. However, in the previous post I only explained how to create a measure which showed the Pareto class. I never showed how to create a dimension based on a Pareto classification – simply because it wasn’t possible.


But now it is.


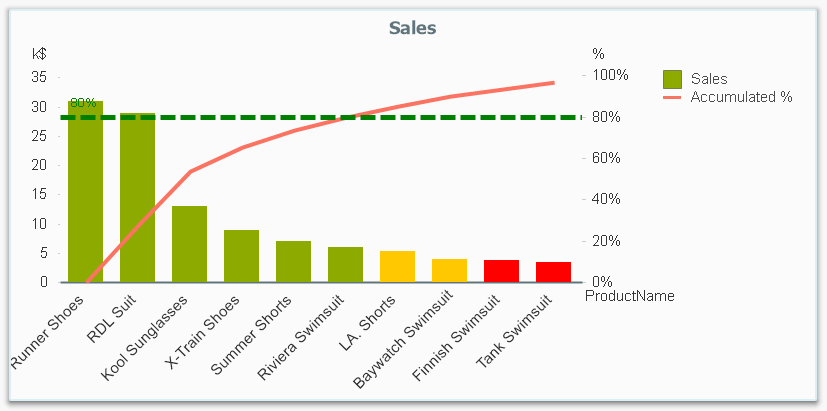
But first things first. The logic for a Pareto analysis is that you first sort the products according to their sales numbers, then accumulate the numbers, and finally calculate the accumulated measure as a percentage of the total. The products contributing to the first 80% are your best, your “A” products. The next 10% are your “B” products, and the last 10% are your “C” products. In the above graph, these classes are shown as colors on the bars.


The previous post shows how this can be done in a chart measure using the Above() function. However, if you use the same logic, but instead inside a sorted Aggr() function, you can achieve the same thing without relying on the chart sort order. The sorted Aggr() function is a fairly recent innovation, and you can read more about it here.


The sorting is needed to calculate the proper accumulated percentages, which will give you the Pareto classes. So if you want to classify your products, the new expression to use is


=Aggr(
    If(Rangesum(Above(Sum({1} Sales)/Sum({1} total Sales),1,RowNo()))<0.8, 'A',
        If(Rangesum(Above(Sum({1} Sales)/Sum({1} total Sales),1,RowNo()))<0.9, 'B',
            'C')),
    (Product,(=Sum({1} Sales),Desc))
    )


The first parameter of the Aggr() – the nested If()-functions – is in principle the same as the measure in the previous post. Look there for an explanation.


The second parameter of the Aggr(), the inner dimension, contains the magic of the sorted Aggr():


    (Product,(=Sum({1} Sales),Desc))


This structured parameter specifies that the field Product should be used as dimension, and its values should be sorted descending according to Sum({1} Sales). Note the equals sign. This is necessary if you want to sort by expression.


So the Products inside the Aggr() will be sorted descending, and for each Product the accumulated relative sales in percent will be calculated, which in turn is used to determine the Pareto classes.


The set analysis {1} is necessary if you want the classification to be independent of the made selection. Without it, the classification will change every time the selection changes. But perhaps a better alternative is to use {$<Product= >}. Then a selection in Product (or in the Pareto class itself) will not affect the classification, but all other selections will.


The expression can be used either as dimension in a chart, or in a list box. Below I have used the Pareto class as first dimension in a pivot table.


QS Pivot.png


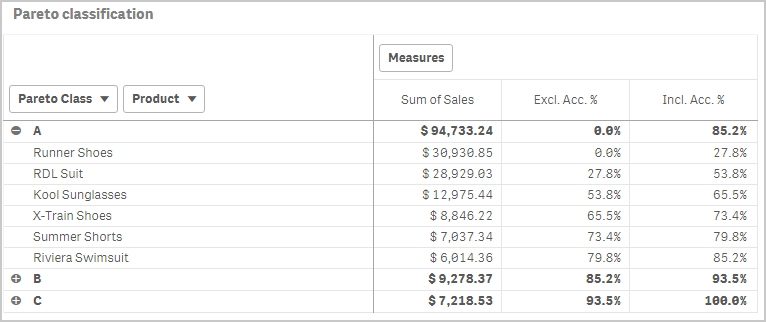
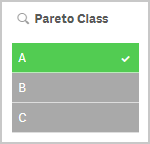
If you use this expression in a list box, you can directly select the Pareto class you want to look at.


QS List box.png


The other measures in the pivot table are the exclusive and inclusive accumulated relative sales, respectively. I.e. the lower and upper bounds of the product sales share:


Exclusive accumulated relative sales (lower bound):


=Min(Aggr(
    Rangesum(Above(Sum({1} Sales)/Sum({1} total Sales),1,RowNo())),
    (Product,(=Sum({1} Sales),Desc))
  ))


Inclusive accumulated relative sales (upper bound):


=Max(Aggr(
    Rangesum(Above(Sum({1} Sales)/Sum({1} total Sales),0,RowNo())),
    (Product,(=Sum({1} Sales),Desc))
  ))


Good luck in creating your Pareto dimension!


HIC


Further reading related to this topic:

The sortable Aggr function is finally here!

Recipe for a Pareto Analysis

Recipe for an ABC Analysis

70 Comments
yurgelmartina
Contributor
Contributor

Hello guys,

I putted as you suggesting but i am having trouble to find the results.

Could you please help me?

Moreover, how can I turn the pivot table chart into the combined graph as image 1?

Capturar.PNGPareto class.PNG

0 Likes
2,155 Views
hic
Former Employee
Former Employee

You have successfully created a Pareto Class as dimension, and it seems to work the way it should. The DCO is not sorted, but that is not really a problem.

However, it sounds as if you want the Pareto Class as a Measure, and then you should not use the Aggr() function. Instead, you should create a measure according to the description on Recipe for a Pareto Analysis. Replace my "Product" field with your "DCO".

Good luck!

HIC

0 Likes
2,155 Views
yurgelmartina
Contributor
Contributor

Ok! thanks.

Is it possible to put the colours and reference line in the graph?

Capturar.PNG

0 Likes
2,123 Views
yurgelmartina
Contributor
Contributor

Sorry forgot to ask again but still learning to use the dashboards:

How can I select only one type of sales: (like in load statement)

load

     sales

from *(QVD)

where

     Type = '2018

=RangeSum(Above(Sum(Sales), 0, RowNo())) / Sum(total Sales) //sugested by you


=RangeSum(Above(Sum({$<Type =  {'2018'} >}  Venda), 0, RowNo())) / Sum(total {$<Type =  {'2018'} >}  Venda) //trying to convert


same here:


=Aggr(


    If(Rangesum(Above(Sum({1} Sales)/Sum({1} total Sales),1,RowNo()))<0.8, 'A',


        If(Rangesum(Above(Sum({1} Sales)/Sum({1} total Sales),1,RowNo()))<0.9, 'B',


            'C')),


    (Product,(=Sum({1} Sales),Desc))


    )

0 Likes
2,123 Views
Anonymous
Not applicable

Hello,

thank you. It is helpful but how can i choose PARETO CLASS as a parameter?

Thanks.

0 Likes
2,123 Views
Helga_W
Employee
Employee

I tried this last week in a POC for a customer using Qlik Sense. Goal was to group customers into A (50% of overall revenue), B (50-95% of overall revenue) and C (the remaining of the overall revenue). Because customer wants to be able to select the "A" or "B" group to further analyze, I have used the formula described in this article to create a calculated dimension. In principle it works well on a relatively small amount of data, however my customer has ~1 million rows in the fact table. With this the calculated dimension is not performant at all. Initial calculation and recalculations take about 90 seconds, which makes it useless for the customer.

Any idea how to make this more performant?

0 Likes
2,123 Views
abeletsky
Partner - Contributor III

Hello everyone.

Is it safe to use undocumented feature about sorting by expression in aggr?

Thanks in advance.

0 Likes
1,987 Views
simonsiplak
Contributor II
Contributor II

Hi,

I want use pareto rule for calculating our top 20 % customers. But when I use formula, it took very long. I have over 200 K customers (rows). Any idea how to solve it?

=Aggr(
    If(Rangesum(Above(Sum({1} Sales)/Sum({1} total Sales),1,RowNo()))<0.8, 'A',
        If(Rangesum(Above(Sum({1} Sales)/Sum({1} total Sales),1,RowNo()))<0.9, 'B',
            'C')),
    (customer_id,(=Sum({1} Sales),Desc))
    )


0 Likes
1,943 Views
abeletsky
Partner - Contributor III

Hello.
You can create a pivot straight table with customer_id as a dimension.
Set sorting by expression Sum({1} Sales) Descending.
Create a measure with label "Cumulative %" and expression
RangeSum(above([Cumulative %]), Sum({1} Sales)/Sum({1} total Sales) ).
Create a measure with expression
If(Rangesum(Above([Cumulative %]))<0.8, 'A',
If(Rangesum(Above([Cumulative %]))<0.9, 'B',
'C')).

I discovered that pivot table has limitations working with interrecord functions, but straight table hasn't.

0 Likes
1,920 Views
simonsiplak
Contributor II
Contributor II

@abeletsky thanks for suggestion. I did it but something strange happen. It looks like that in the middle of "Cumulative %" column it is restarting RangeSum (see image below). Do you have and idea what could be wrong? 

I expect that last row should 100 % in "Cumulative %" column, right?


Screen.png

0 Likes
1,908 Views