Announcements
Live today at 11 AM ET. Get your questions about Qlik Connect answered, or just listen in. SIGN UP NOW
hic
Former Employee
Former Employee

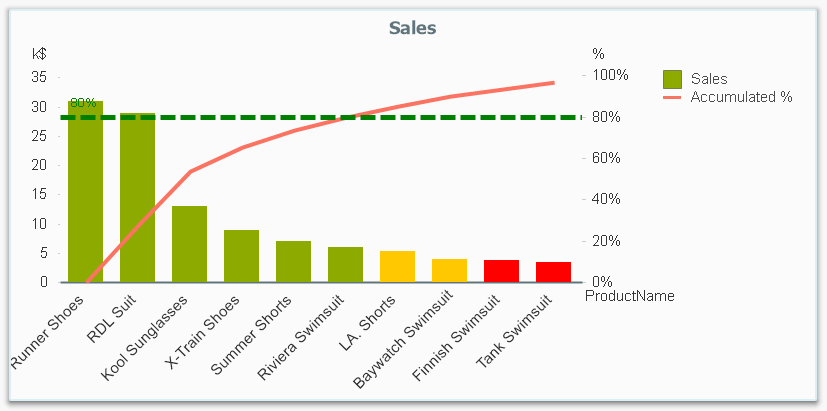
“Which products contribute to the first 80% of our turnover?”

This type of question is common in all types of business intelligence. I say “type of question” since it appears in many different forms: Sometimes it concerns products, but it can just as well concern any dimension, e.g. customer, supplier, sales person, etc. Further, here the question was about turnover, but it can just as well be e.g. number of support cases, or number of defect deliveries, etc.
 

QV Bar chart.png


It is called Pareto analysis or ABC analysis and I have already written a blog post on this topic. However, in the previous post I only explained how to create a measure which showed the Pareto class. I never showed how to create a dimension based on a Pareto classification – simply because it wasn’t possible.


But now it is.


But first things first. The logic for a Pareto analysis is that you first sort the products according to their sales numbers, then accumulate the numbers, and finally calculate the accumulated measure as a percentage of the total. The products contributing to the first 80% are your best, your “A” products. The next 10% are your “B” products, and the last 10% are your “C” products. In the above graph, these classes are shown as colors on the bars.


The previous post shows how this can be done in a chart measure using the Above() function. However, if you use the same logic, but instead inside a sorted Aggr() function, you can achieve the same thing without relying on the chart sort order. The sorted Aggr() function is a fairly recent innovation, and you can read more about it here.


The sorting is needed to calculate the proper accumulated percentages, which will give you the Pareto classes. So if you want to classify your products, the new expression to use is


=Aggr(
    If(Rangesum(Above(Sum({1} Sales)/Sum({1} total Sales),1,RowNo()))<0.8, 'A',
        If(Rangesum(Above(Sum({1} Sales)/Sum({1} total Sales),1,RowNo()))<0.9, 'B',
            'C')),
    (Product,(=Sum({1} Sales),Desc))
    )


The first parameter of the Aggr() – the nested If()-functions – is in principle the same as the measure in the previous post. Look there for an explanation.


The second parameter of the Aggr(), the inner dimension, contains the magic of the sorted Aggr():


    (Product,(=Sum({1} Sales),Desc))


This structured parameter specifies that the field Product should be used as dimension, and its values should be sorted descending according to Sum({1} Sales). Note the equals sign. This is necessary if you want to sort by expression.


So the Products inside the Aggr() will be sorted descending, and for each Product the accumulated relative sales in percent will be calculated, which in turn is used to determine the Pareto classes.


The set analysis {1} is necessary if you want the classification to be independent of the made selection. Without it, the classification will change every time the selection changes. But perhaps a better alternative is to use {$<Product= >}. Then a selection in Product (or in the Pareto class itself) will not affect the classification, but all other selections will.


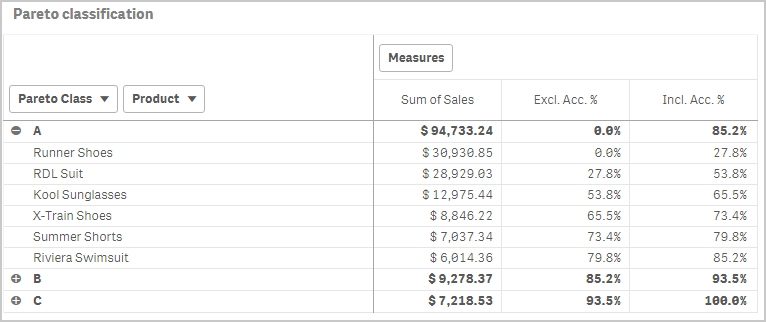
The expression can be used either as dimension in a chart, or in a list box. Below I have used the Pareto class as first dimension in a pivot table.
 

QS Pivot.png


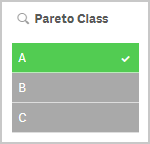
If you use this expression in a list box, you can directly select the Pareto class you want to look at.
 

QS List box.png


The other measures in the pivot table are the exclusive and inclusive accumulated relative sales, respectively. I.e. the lower and upper bounds of the product sales share:


Exclusive accumulated relative sales (lower bound):


=Min(Aggr(
    Rangesum(Above(Sum({1} Sales)/Sum({1} total Sales),1,RowNo())),
    (Product,(=Sum({1} Sales),Desc))
  ))


Inclusive accumulated relative sales (upper bound):


=Max(Aggr(
    Rangesum(Above(Sum({1} Sales)/Sum({1} total Sales),0,RowNo())),
    (Product,(=Sum({1} Sales),Desc))
  ))


Good luck in creating your Pareto dimension!


HIC


Further reading related to this topic:

The sortable Aggr function is finally here!

Recipe for a Pareto Analysis

Recipe for an ABC Analysis

70 Comments
abeletsky
Partner - Contributor III

Hi.

My guess you have not one dimension, so "Cumulative %"  restarts, when above() sees new dimension segment.

Try to add TOTAL in above().

0 Likes
1,795 Views
abeletsky
Partner - Contributor III

Hi again.

I think I know why my proposal doesn't work properly.

It is related to "Self-referencing expression".

Quote from Qlik Sense November 2018 help: "Self-referencing expression definitions can only reliably be made in tables with fewer than 100 rows, but this may vary depending on the hardware that the Qlik engine is running on."

Link to help:

https://help.qlik.com/en-US/sense/November2018/Subsystems/Hub/Content/Sense_Hub/ChartFunctions/Inter...


1,783 Views
yurgelmartina
Contributor
Contributor

ignore

0 Likes
1,707 Views
yurgelmartina
Contributor
Contributor

Hello,

Only a some questions:

Option #1

1) How can I make the filter of Pareto Class fixed? If I choose A for example it recalculates all over again.

Filter:  =Aggr(
If(Rangesum(Above(Sum({1} Sales)/Sum({1} total Sales),1,RowNo()))<0.5, 'A',
If(Rangesum(Above(Sum({1} Sales)/Sum({1} total Sales),1,RowNo()))<0.8, 'B',
'C')),
([Assortment Group],(=Sum({1} Sales),Desc))
)

Dimension: [Assortment Group]

Measure X: Sum(Sales)

Measure Y (Inclusive Percentage): RangeSum(Above(Sum(Sales), 0, RowNo())) / Sum(total Sales)

2) How can the Y Line does not change the colour?

The Colour Expression that I created was:

 If(RangeSum(Above(Sum(Sales),1,RowNo())) / Sum(total Sales) <= 0.5, Green(),
If(RangeSum(Above(Sum(Sales),1,RowNo())) / Sum(total Sales) <= 0.8, Yellow(), ))


Option #2

Filter:  =Aggr(
If(Rangesum(Above(Sum({1} Sales)/Sum({1} total Sales),1,RowNo()))<0.5, 'A',
If(Rangesum(Above(Sum({1} Sales)/Sum({1} total Sales),1,RowNo()))<0.8, 'B',
'C')),
([Assortment Group],(=Sum({1} Sales),Desc))
)

Dimension: [Assortment Group]

Measure X: Sum(Sales)

Measure Y (Inclusive Percentage): RangeSum(Above(Sum(Sales), 0, RowNo())) / Sum(total Sales)

The Colour Expression that I created was:

=Aggr(If(RangeSum(Above(Sum(Sales), 0, RowNo())) / Sum(total Sales))<0.5,Green(),
If(RangeSum(Above(Sum(Sales), 0, RowNo())) / Sum(total Sales)<0.9, Yellow(),Red(),
([Assortment Group],(=Sum({1} Sales),Desc))))


0 Likes
1,703 Views
joan
Contributor
Contributor

Hello all,

i am quite new using Qlik Sense and I have an issue regarding this post Recipe for a Pareto Analysis . 

I have done the Pareto analysis creating the master dimension for the ABC classification, but now I would like to create a KPI that indicates, for instance, the number of clients that are 'A', or the sum of sales for the 'A' clients. So I need to use set analysis or a sum (if ...) function but I don't really know whether this is possible or not, and if it is possible I don't know how to do it...

I would really appreciate if someone in the qlik community could help me with this!

Thank you very much in advance 

Joan

0 Likes
1,688 Views
ronaldwang
Creator III
Creator III

Thanks Henric,

Nice one, for the horizontal axis, is there a way we can show continuous number of suppliers instead, so that the accumulated spend is against of number of suppliers. 


0 Likes
1,424 Views
alex_nerush
Partner - Creator II

Hello @hic ! Can we use the following syntax in aggr for sorting?  (Product,(=Sum({1} Sales),Desc), (TEXT, ASCENDING))... It looks like it works. Ability to sort by expression is still undocumented. In my case i need to select A, B or C category by pressing a button. So, it should select the same products as it is displayed in a chart. There are some cases when products between A and B categories (or between B and C) have the same values.  In such a cases without using second sorting parameter (TEXT, ASCENDING) aggr function will sort the products by Sales amount and load order... but not by Sales amount and Alphabetical order as it needed in my case... 

1,237 Views
GreatGreekYogurt
Contributor III
Contributor III

Hi,

How can we get dotted reference line in combo chart in newest Qlik Sense versions? It's not with the Add-ons.

0 Likes
854 Views
ArchanaB
Contributor III
Contributor III

Hi Henric, 

thank you for detailed explanation. I need to apply the same logic for one of the KPI. I need to get supplier with 80% spend . But In qlik Sense , the "DESC" is not working in KPI expression . I am using below formula and DESC is not supported in it so it is not working for me 

sum(aggr(if((RangeSum(Above(SUM({<$(vSet), GP_IN_COUNTRY = {'Y'}>}SPEND_ACTUAL),1,RowNo()))/sum({<$(vSet),GP_IN_COUNTRY = {'Y'}>}TOTAL SPEND_ACTUAL)) <= 0.8,
1,
0)
,(PARENT_SUPPLIER_ID,(=SUM({<$(vSet), GP_IN_COUNTRY = {'Y'}>}SPEND_ACTUAL)),DESC)))


Please suggest me how we can apply sorting in qlik sense ?


0 Likes
861 Views
abeletsky
Partner - Contributor III

Hi. 

Take a careful look where to put DESC.

In your example you have closed =SUM too early

...(=SUM({<$(vSet), GP_IN_COUNTRY = {'Y'}>}SPEND_ACTUAL)),DESC)

Must be

...(=SUM({<$(vSet), GP_IN_COUNTRY = {'Y'}>}SPEND_ACTUAL),DESC)

847 Views