Announcements
Qlik Connect 2024! Seize endless possibilities! LEARN MORE
hic
Former Employee
Former Employee

A common question in the QlikCommunity forum is how to show only the last N months. The suggested answers are most of the time relatively complex set analysis expressions including dollar expansions with aggregation functions, e.g.

     Sum( {$<Date={">=$(=MonthStart(AddMonths(Max(Date),-12)))<$(=MonthEnd(Max(Date)))"}>} Sales)

Such an expression may work fine. However, it is not simple. When seen by someone who didn't write it, it is almost incomprehensible. So instead of such an expression, I would like to suggest a slightly different method: Relative calendar fields.

The idea is to define relative calendar fields in the master calendar. By doing this, it will be a lot simpler to define chart expressions. For example, you can in your master calendar define fields calculating how many days or months ago a specific date was:

     Today() - Date as DaysAgo,
     12*(Year(Today())-Year(Date)) + Month(Today()) - Month(Date) as MonthsAgo,

Then you will be able to have much simpler chart expressions, e.g:

     Sum({$<MonthsAgo={">=0<12"}>} Sales)

This expression does almost the same as the initial expression. But it is much easier to read and understand. Below you have a chart using this expression showing the last 12 months. (Financial year that starts in April; today is a day in June and the dimensions are rolling month [Date(MonthStart(Date),'MMM')] and fiscal year.)

Bar Chart Last 12.png

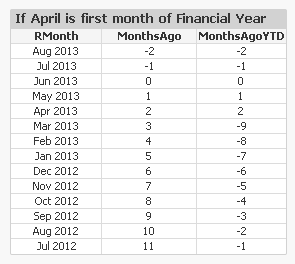
Further, you can also create fields for relative months within the financial year; fields that you can use for a year-on-year comparison:

     Today() - YearStart(Today(),0,$(vFM)) - Date + YearStart(Date,0,$(vFM)) as DaysAgoYTD,
     Mod(Month(Today())-$(vFM),12) - Mod(Month(Date)-$(vFM),12) as MonthsAgoYTD,

The variable vFM is the first month of the financial year, see more on Fiscal Year.
MonthsTable.png

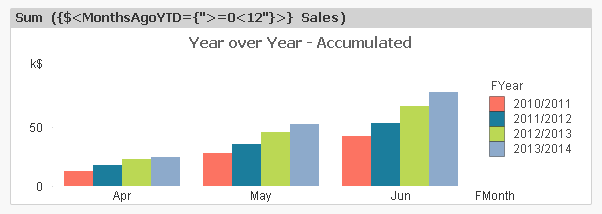
If you have these fields defined, you can easily make a year-to-date chart comparing the different years. The expression will be the same as before, but with MonthsAgo changed to MonthsAgoYTD:

     Sum({$<MonthsAgoYTD={">=0"}>} Sales)

Below you have a chart of a year-over-year comparison (using the built-in accumulation):
Bar Chart YoY.png

Bottom line: By defining relative dates and months in your master calendar, you can significantly simplify your set analysis expressions. Also, such fields will help your users create new charts. And your charts may even evaluate faster...


Simplicity.

HIC

23 Comments
Not applicable

Henric,

Thank you very much for the useful blog.

I have now added the following to my Calendar script

MonthName(today()) as This_Month,

MonthName(AddMonths(today(),-1)) as Prev_Month

Now I need to be able to show in a pivot or streight table, a total of sales for clients ONLY when there is a difference exceeding +-20% in this month's sales compared to last months'.

What do you suggest is the best way?

Thanks for any help. I've tried to put together some set analysis expressions, but it is not working...

Cheers,

fcrysss


0 Likes
3,299 Views
Lee_Matthews
Former Employee
Former Employee

Dion

I use a flag in my master calendar specifically for rolling 12 mth (and prior rolling 12 mth). First set a variable vToday based on todays date, then add the lines below to the master calendar final load. This code ignores the current 'incomplete' month.


if(TempDate>=monthstart(AddMonths($(vToday), -12)) AND TempDate<monthstart($(vToday)), 1, 0) as Rolling12MthFlag,

if(TempDate>=monthstart(AddMonths($(vToday), -24)) AND TempDate<monthstart(AddMonths($(vToday), -12)), 1, 0) as RollingPrior12MthFlag
0 Likes
3,299 Views
barryharmsen
Luminary Alumni
Luminary Alumni

Good post, it's always a good idea to make things as simple as possible for yourself!

Regarding time periods relative to the selected date, I use generated sequence numbers for days, weeks, months, quarters, etc. to make those expressions a lot easier. For example:

Month: Seq

Jan-12: 1

Feb-12: 2

Mar-12: 3

.....

.....

Dec-12: 12

Jan-13: 13

Feb-13: 14

Mar-13: 15

etc.

Instead of having to write all sorts of complicated set analysis statements, especially when crossing years, now if I want to get the rolling 6 months, I can just use:

sum( {<MonthSeq={"<=$(#=max(MonthSeq))>$(#=max(MonthSeq)-6)"}>} Revenue)

Add that statement to a variable named s.Month.Rolling6 and you can reuse it everywhere:

sum( {<$(s.Month.Rolling6)>} Revenue)

Notice that I left the set enclosure out of the variable, so that you can add additional modifiers if necessary.

For more information, the whole thing is quite well explained by Miguel Garcia in his "Magic of Set Analysis" blog post: http://iqlik.wordpress.com/2010/11/27/the-magic-of-set-analysis-point-in-time-reporting/

3,268 Views
Not applicable

As I'm very new to Qlikview, this is a great help. One question though, how would I create a WeeksAgo calendar field? My best guess was

52*(Week(Today())-Week(TempDate)) + Week(Today()) - Week(TempDate) as WeeksAgo

but this doesn't seem to work

0 Likes
3,268 Views
hic
Former Employee
Former Employee

The Week() function "restarts" at 1 every year, so you cannot use this if the two dates span two years. No, I would probably do

     (WeekStart(Today()) - WeekStart(Date))/7

instead. To understand what this does you need to understand how QlikView handles dates. Read about this here. But to make a long story short: The WeekStart() function returns an integer corresponding to the day. So by taking the diff and dividing by 7, you get the number of weeks ago.

HIC

0 Likes
3,268 Views
Not applicable

Perfect. Thank you so much!

0 Likes
3,268 Views
Not applicable

Excellent post and a great deal of wisdom shared.

Many thanks!!

0 Likes
3,268 Views
richard_pearce6
Luminary Alumni
Luminary Alumni

Hi Henric, Here's a post the creates an 'AsOf' Calendar which can be used to create simple set analysis

http://community.qlik.com/docs/DOC-6593

Regards

Richard

3,268 Views
Not applicable

Excellent post

Thank you

0 Likes
3,261 Views
sudeepkm
Specialist III
Specialist III

Hi Barry,

Are there any way we can use only rolling months across all years. The sequence might not work in that case. It is like taking all months in to a cycle or circle than a sequence or st. line.

For example if current month is Jan then data shows Jan till Apr (4 rolling months) and if the current month is Oct then Oct till Jan across all the available years. Creating a Flag would be great.

Thanks

0 Likes
3,261 Views