Unlock a world of possibilities! Login now and discover the exclusive benefits awaiting you.
- Subscribe to RSS Feed
- Mark as New
- Mark as Read
- Bookmark
- Subscribe
- Printer Friendly Page
- Report Inappropriate Content
The first category is Nominals. These are fields with discrete, qualitative values. There is no inherent quantitative difference between different values of a field. Examples: Product, Customer, Color, Gender, etc.
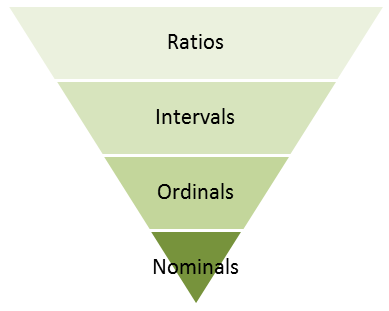
The second category is Ordinals. These fields also have discrete values but the fields differ from the Nominals in that they have an intrinsic order. Examples:
- low, medium, high
- tiny, small, medium, large, huge
- unsatisfied, neutral, satisfied
The ordinals can sometimes be numeric but should still not be thought of as numeric, since the distance between one value and the next may differ from case to case. This means that you cannot calculate an average – but you can calculate a median.
The next category is numeric: Intervals. These can be discrete or continuous. Examples: Date, Time, Longitude, Latitude, Temperature (°C or °F). What makes them different from Ordinals is that the difference between two values is well-defined: The difference between a temperature of 0 degrees and 10 degrees is the same as between 70 degrees and 80 degrees. Such fields always describe a position in time, in space or in some other dimension. I find the term “Interval” to be confusing so I think of them as Coordinates instead.
Intervals are not additive, so you cannot sum them. However, you can calculate a difference between two values and use this value for further calculations.
The last category is Ratios. The Ratio category is the most informative one. It has all properties of the Interval category, with the additional property that zero is special: it indicates the absence of the quantity. Examples: Sales amount, Weight, Length, Order quantity, etc. Further, they are often additive. Since I think the term “Ratio” is misleading, I think of them as Amounts instead.
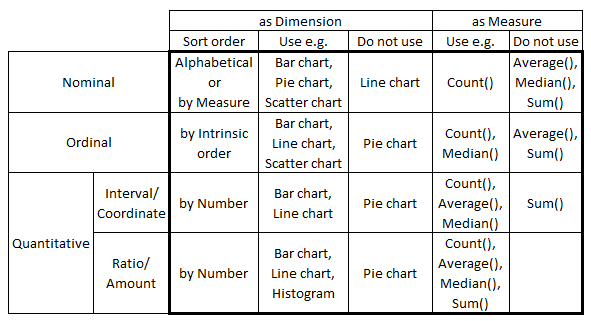
The above taxonomy was created by the psychologist S. S. Stevens in the early 1940s and is normally referred to as Scales of Measurement. Although it has been criticized from a scientific perspective, I find the classification useful since a number of rules of thumb for visualizations can be tied to this model. For instance:
- Nominals should be sorted by a measure or alphabetically. Other categories should be sorted according to the intrinsic sort order.
- Nominals should never be used as first dimension in a Line chart, since this chart type implies an intrinsic sort order.
- Pie charts should not be used, unless the dimension is a Nominal.
- Scatter charts are best if they have a Nominal or Ordinal as dimension.
- Continuous Intervals and Ratios should normally not be used as dimensions. Use Round() or Class() to make them discrete.
- Ordinals should not be used to calculate an average.
- Intervals should not be used to calculate a sum.
- The axis of a Ratio should start at zero and not be broken.
I am sure that some of you can find exceptions to the above “rules”, but as I said – they are only rules of thumb.
The bottom line is that you should think about the field categorization before you create your visualizations. Thank you Michael B for inspiration and discussions.
Further reading related to this topic:
You must be a registered user to add a comment. If you've already registered, sign in. Otherwise, register and sign in.