Announcements
Qlik Connect 2024! Seize endless possibilities! LEARN MORE
hic
Former Employee
Former Employee

When a calculation is made in a QlikView session, it always involves an aggregation over the relevant data records. But which records are relevant? What is the scope of the aggregation?

This seems like a simple question, but there are in fact quite a few things that could be said about it.


Normally, there are two different restrictions that together determine which records are relevant: The Selection, and – if the formula is found in a chart – the Dimensional value. The aggregation scope is what remains after both these restrictions have been taken into consideration.


But not always…


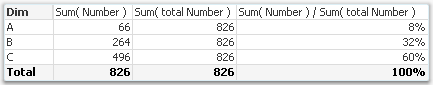
There are ways to define your own aggregation scope: This is needed in advanced calculations where you want the aggregation to disregard one of the two restrictions. A very common case is when you want to calculate a ratio between a chosen number and the corresponding total number, i.e. a relative share of something.


Aggregation expression 2.png


In other words: If you use the total qualifier inside your aggregation function, you have redefined the aggregation scope. The denominator will disregard the dimensional value and calculate the sum of all possible values. So, the above formula will sum up to 100% in the chart.


Dimensional scope.png


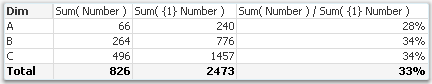
However, there is a second way to calculate percentages. Instead, you may want to disregard the the selection in order to make a comparison with all data before any selection. Then you should not use the total qualifier; you should instead use Set analysis:


Aggregation expression 3.png


Using Set analysis, you will redefine the Selection scope. The set definition {1} denotes the set of all records in the document; hence the calculated percentages will be the ratio between the current selection and all data in the document, split up for the different dimensional values.


Selection scope.png


In other words: by using the total qualifier and set analysis inside an aggregation function, you can re-define the aggregation scope.


  • To disregard the dimensional grouping – Use the Total qualifier
  • To disregard the selection – Use Set Analysis


The above cases are just the basic examples. The total qualifier can be qualified further to define a subset based on any combination of existing dimensions, and the Set analysis can be extended to specify not just “Current selection” and “All data”, but any possible selection.


And, of course the total qualifier can be combined with Set analysis.


Aggregation expression.png


A final comment: If an aggregation is made in a place where there is no dimension (a gauge, text box, show condition, etc.), only the restriction by selection is made. But if it is made inside a chart or an Aggr() function, both restrictions are made. So in these places it could be relevant to use the total qualifier.


HIC


Further reading related to this topic:

What does the TOTAL qualifier do?

Totals in Charts

A Primer on Set Analysis

13 Comments
israrkhan
Specialist II
Specialist II

Hi HIC

Thank you for such a nice blog.

i have read your, almost all blog post, and learnt a lot from your blogs.

keep writing please.

Khan

0 Likes
38,037 Views
Not applicable

please have a look at the expression below.


Sum({$<Region= {'West'} >} Total <City> Sales)


what is this expression calculating?  Is <city> means {<city=>}?


0 Likes
38,037 Views
israrkhan
Specialist II
Specialist II

Hi, Ikram.

Normaly expressions group data by dimensions, but this expression will ignore the dimensions, because you used the TOATL Keyword, TOTAL means ignore the dimension,(or dont group data by dimension).

and you passed the <City> field to expression, its means Group Sales by City.

{<City=>} means  = all cities.

<City> Means Group by City.

Hope it helps.

0 Likes
38,037 Views
hic
Former Employee
Former Employee

Ikram

The {$<Region={'West'}>} is your Selection scope.

The total <City> is your Dimensional scope, meaning that the aggregation will disregard all dimensions except City.

HIC

38,037 Views
bimartingo
Contributor III
Contributor III

Very good your explanation. In fact, selections, aggregations, set analisys, and how the combinations of them affect the result of expressions in different objects (Charts, Tables, ) would probably give a book only on this thema, particularly Pivot Charts.

And the Aggr() is quite a mystery to me.

Thanks.

0 Likes
38,037 Views
hic
Former Employee
Former Employee

You're right that there is enough information to write an entire book about these things...

Concerning the Aggr() function - It can make things look extremely complicated, but it is really quite straightforward: It is a nested aggregation. Example:

If   Avg( Sales ) calculates the average sales value per record in the database, then

     Avg( Aggr( Sum( Sales ), OrderID )) calculates the average sales value per order.

That is, the Aggr function creates "a virtual table" with one line per order - and then the Avg() calculates the average of the lines in this table.

Take a look at http://community.qlik.com/blogs/qlikviewdesignblog/2013/03/07/aggr and I am sure it will become clearer.

HIC

38,037 Views
Anonymous
Not applicable

neither the blog post or tech brief or help file explain this, which someone else asked on that post you mentioned. Looks like a decent subject for another blog

- According to the documentation one can place SET ANALYSIS in 3 different places in an AGGR expression. For example to create a SET for Year=2013:

avg({$<Year={2013}>}AGGR(DISTINCT {$<Year={2013}>} sum({$<Year={2013}>}  Sales),Country))

Are all  3 Sets necessary to retrieve the correct result?

0 Likes
28,973 Views
b_garside
Partner - Specialist

Great question, I've often wondered that myself. I'm sure there is an answer.

0 Likes
28,973 Views
Anonymous
Not applicable

I am doing some tests myself because I cannot find explanation and most people i asked told me to keep trying till i get desired results but no one can explain me the internals. It is amazing how many stuff in QV people do not understanding how it really works.

Anyway based on my first experiments, looks like the scope of aggr and the scope of outer aggregate are totally independent but they both respect dimension scope. For that reason set expression needs to be duplicated in both inner and outer aggregation in the question above.

AGGR function is amazing but I believe it needs to be documented better in QV manual - we should not spend hours on forums, reading books and tech. briefs to find answers like that.

0 Likes
28,973 Views
b_garside
Partner - Specialist

That is interesting. I've assumed the Set analysis on the outer was sufficient to override the inner.

I agree this function has not been documented fully in one QV manual. There is a tech brief, but still doesn't answer this question.

0 Likes
28,973 Views