Announcements
Qlik Connect 2024! Seize endless possibilities! LEARN MORE
hic
Former Employee
Former Employee

Last week I wrote about how the Above() function can be used for calculating rolling averages and other accumulations. There is however also an alternative method for doing the same thing:

The As-Of table.

When you use the Above() function, you fetch a number from other rows in a chart or Aggr() table. The As-Of table is slightly different in this respect: It is not a transient table created by an object or an expression – instead it is a real table in the data model.

The idea is to create a secondary month field – the AsOfMonth - that links to multiple real months.
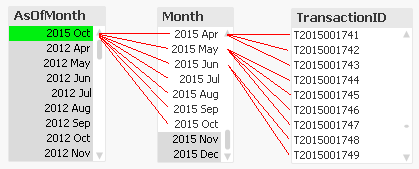
 

Fields.png


In the example above, you can see that ‘2015 Oct’ links to several preceding months, and each Month in turn links to several rows in a fact table. This means that a specific transaction will be linked to several AsOfMonths.

In the data model, the As-Of table should appear as a separate calendar table that links to the existing primary calendar table:
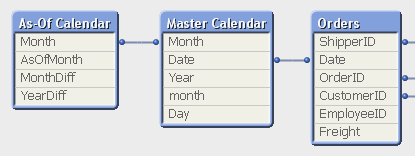
 

DataModel.png


One way to create this table is the following:

First, make sure that you in your master calendar have a field “Month” that is defined as the first date of the month, e.g.


Date(MonthStart(Date),'YYYY MMM') as Month,


Then add the following lines at the end of the script:


// ======== Create a list of distinct Months ========
tmpAsOfCalendar:
Load distinct Month
  Resident [Master Calendar] ;

// ======== Cartesian product with itself ========
Join (tmpAsOfCalendar)
Load Month as AsOfMonth
  Resident tmpAsOfCalendar ;

// ======== Reload, filter and calculate additional fields ========
[As-Of Calendar]:
Load Month,
  AsOfMonth,
  Round((AsOfMonth-Month)*12/365.2425) as MonthDiff,
  Year(AsOfMonth)-Year(Month) as YearDiff
  Resident tmpAsOfCalendar
      Where AsOfMonth >= Month;

Drop Table tmpAsOfCalendar;


Once this table has been created, you can use the AsOfMonth as dimension in charts where you want rolling averages and accumulations.

If you as measure use


Sum({$<YearDiff={0}>} Sales)


you will get a yearly accumulation – year-to-date up until the day of the script run.
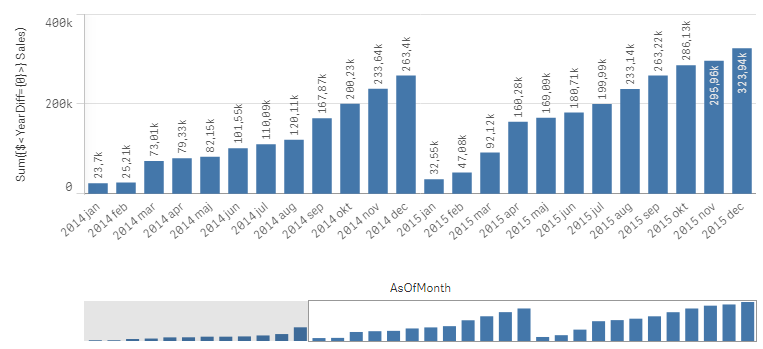
 

Yearly accumulation.png


If you instead use


Sum({$<MonthDiff={"<6"}>} Sales) / Count(distinct {$<MonthDiff={"<6"}>} Month)


you will get a 6-month rolling average:
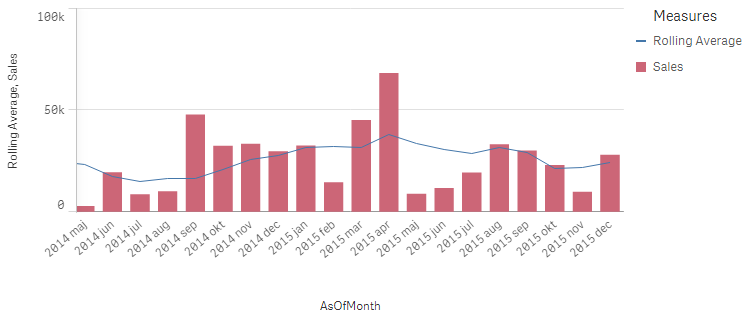
 

Rolling average.png

And finally, if you use


Sum({$<MonthDiff={0}>} Sales)


You will get the real, non-accumulated numbers.

I have made the Set Analysis expressions based on two fields: YearDiff and MonthDiff. However, for clarity it could be a good idea to add flags in the As-Of table, so that the Set Analysis expressions become even simpler, e.g.


If(MonthDiff=0,1,0) as IsSameMonth,
If(YearDiff=0,1,0) as IsSameYear,
If(MonthDiff<6,1,0) as IsRolling6,


Summary: The As-Of table is a good way to calculate rolling averages and accumulations.


HIC


Further reading related to this topic:

The Above Function

Accumulations

Calculating rolling n-period totals, averages or other aggregations

103 Comments
anderseriksson
Partner - Specialist

And again it could be done entirely with set analysis without the need of an As-Of table as long as you have control over your calendar dimensions.
The suggestion using Above can be tricky because it depends on the sorting order of the table.
With a customizable table you might not have control over that.

0 Likes
1,875 Views
kinahan7
Contributor III
Contributor III

Do you happen to have an example qvw with Sales and PM Sales by Month in a pivot?  I understand that I can get Current Month and Previous Month sales in an expression, what I'm having difficulty with is showing it by Month.

0 Likes
1,875 Views
Gysbert_Wassenaar

With only set analysis it's a lot harder. A set analysis expression set is calculated at the chart level. If you want different sets for each value of a month dimension like Cory needs you need a rather big nested if or pick-match combination to calculate the correct set for each month value. See for example Evaluating "sets" in the context of a dimension for more information

0 Likes
1,938 Views
Anonymous
Not applicable

Hello,

maybe I have overseen it, but I try to use the as of table for a rolling n month chart with filter on the current Year. Due to the usability I want to do the Selection by the Year field of my Master Calendar and not by the AsOfYear field from my as of table.
But in that case I get only the Month value for January displayed and not the sum of December and January for the first displayed Month 2018/01.

as of table.JPG

Is there a possibility to solve this by expression like in that example?

Calculating rolling n-period totals, averages or other aggregations

Currently I use a expression like:  sum(  { < MonthDiff={"<2"}  > } [Calls] )

Many thanks,

Claus

Edit:

The below expression is doing what I need:

=aggr( above ( Sum( { 1 < MonthDiff={"<2"} > } [Calls]) , 0, 2 ), AsOfMonth )

0 Likes
1,938 Views
rajinikanth
Contributor III
Contributor III

Hi Henric,

Thanks in advance

In the below example you wrote

Round((MonthStart(AsOfDate)-MonthStart(Date))*12/365.2425) as MonthDiff,(What is the logic behind multiplying with *12/365.24.25)


Can we have Asofweek and week difference in the same calendar by multiplying with any other numerics?

tmpAsOfCalendar:
Load distinct Date
Resident [Master Calendar] ;

// ======== Cartesian product with itself ========
Join (tmpAsOfCalendar)
Load Date as AsOfDate
Resident tmpAsOfCalendar ;

// ======== Reload, filter and calculate additional fields ========
[As-Of Calendar]:
Load Date,
AsOfDate,
AsOfDate - Date as DateDiff,
Round((MonthStart(AsOfDate)-MonthStart(Date))*12/365.2425) as MonthDiff,
Year(AsOfDate)-Year(Date) as YearDiff
Resident tmpAsOfCalendar
Where AsOfDate >= Date;
Drop Table tmpAsOfCalendar;

0 Likes
1,938 Views
hic
Former Employee
Former Employee

To calculate MonthDiff you need to divide the number of days between the two monthstarts with the average month length, which is 365.2425/12. Hence this number.


In my example I have an as-of table based on months. If you instead want a finer granularity, e.g. days, you can do this by loading dates instead of months:


tmpAsOfCalendar:

Load distinct Date

  Resident [Master Calendar] ;


and define AsOfDate, AsOfWeek, and AsOfMonth accordingly. To define WeekDiff is then straightforward:


(WeekStart(AsOfDate)-WeekStart(Date))/7 as WeekDiff,


HIC

0 Likes
1,938 Views
Tyler_Waterfall
Employee
Employee

Excellent again Henric - After numerous attempts at this, I finally read this post about cumulative counts and it works like a champ.

0 Likes
1,938 Views
robert99
Specialist III
Specialist III

Hi

Thank you HIC for this post. This is easily the best way I have found to do accumulations. Above etc is just too limited. 

But I'm unsure if there is a better way to do what I have done below. It works but its certainly not straight forward. Or intuitive.


My view is Qlik should allow users to link to dimensions in measures as say PBI does. I can see that the Qlik approach is different to PBI (overall the user outcome is better in Qlik but it can be confuisng to get the required outcome) but this is one area where IMHO Qlik should have a look at how PBI does it.  Accumulations are easy in PBI. Its very confusing in Qlik because the measure can't link to the dimension using set analysis. Either within set analysis or to ignore a selection(s).


Anyway I was asked to set up a debtors report. Where the user selected one MonthYear and the table would show the closing balances for the last say 6-7 Months.

Initially to get the Months closing balance for a period was easy enough. I could use MonthsAgo and a selected MonthYear

sum({<CanonType = {TransDate}
,GLTransType = {ARDetail,ARAllocate} ,
Year = , YearFin = , Month = , WeekEnding = , MonthYear = 
, MonthsAgo = { ">=$(=MonthsAgo)" }
>}   ARValue)

But then I set up AsOfMonth (to do a table with Month Ends  of closing balances) so planned to use  only AsOfMonth filter selections. To overcome this drawback

 https://community.qlik.com/t5/Qlik-Design-Blog/Accumulations/ba-p/1466581

"However, it has one drawback: When a user clicks in the chart, a selection will be made in the AsOfMonth. But you don’t want the user to make selections here: You want month selections to be made in the real month field. So I usually make my charts read-only if they use the AsOfMonth as dimension."  Howeevr in Sense it is not possible to make a chart read only


Easy enough with the closing balance only with this measure

sum({<CanonType = {TransDate}
,GLTransType = {ARDetail,ARAllocate} ,
>}   ARValue)

But doing the requested table was not so straight forward.

DebtorsOverdue.JPG

I could not find a way to use ONE AsOfMonth filter selection. why? For two reasons its seems

  • Qlik can not link to a dimension in set analysis. So an 'if statement' has to be used instead
  • Also its not possible to ignore a selection when a link is made using "if" in this way.  Which is inconsistent with how Qlik usually works

So this measure didn't work with a filter  selection AsOfMonth = Dec2018. Even though my measure is instructed to ignore this selection

sum({<CanonType = {TransDate} //
,GLTransType = {ARDetail,ARAllocate}
,MonthYear = , WeekEnding =, AsOfMthYr= , AsofMonth=
,AsofMth_MthsAgo = {"<=$(=max(AsofMth_MthsAgo)+6) >=$(=max(AsofMth_MthsAgo)+0)"}
>}if( ARInvDate +90 > monthend(AsOfMonth)   and ARInvDate +60 < monthend(AsOfMonth)  ,ARValue))

But it did using MonthYear. As did this

sum({<CanonType = {TransDate} //
,GLTransType = {ARDetail,ARAllocate}
,MonthYear , WeekEnding , AsOfMthYr, AsofMth_MthsAgo
,AsofMth_MthsAgo = {"<=$(=max(MonthsAgo)+6) >=$(=max(MonthsAgo)+0)"}
>}if( ARInvDate +90 > monthend(AsOfMthYr)   and ARInvDate +60 < monthend(AsOfMthYr)  ,ARValue))

I'm unsure why Qlik has been set up in this way. I guess it works but I'm still confused why Qlik has designed this to be so confusing. When everything else about Qlik is logical and often when understood straight forward. Some of these accumulation work around should really not be needed. Its a common requirement and Qlik should handle this area much easier. Using 'above' and AsOfMonth etc are work arounds that do work well when finally understood but should be a built in feature.

//---------AsOfMonth-------------------------------------------------------------------------

// ======== Create a list of distinct Months ========
tmpAsOfCalendar:
Load distinct MthYear
  Resident [Calendar] ;

 // ======== Cartesian product with itself ========
Join (tmpAsOfCalendar)
Load MthYear as AsOfMonth
  Resident tmpAsOfCalendar ;
// ======== Reload, filter and calculate additional fields ========
[As-Of-Calendar]:
Load MthYear,
  AsOfMonth,
  AsOfMonth as AsOfMthYr,
  Round((AsOfMonth-MthYear)*12/365.2425) as MonthDiff,
  12*(Year(Today())-Year(AsOfMonth)) + Month(Today()) - Month(AsOfMonth) as AsofMth_MthsAgo,
 
  Year(AsOfMonth)- year(MthYear) + If(num(Month(MthYear))>= 10 , -1, 0)  
  + If(num(Month(AsOfMonth))>= 10 , 1, 0)  
  as  AsOfMth_YrFinDiff ,
 
  Year(AsOfMonth)-Year(MthYear) as YearMthAgoDiff
  Resident tmpAsOfCalendar
      Where AsOfMonth >= MthYear;

Drop Table tmpAsOfCalendar;


0 Likes
1,888 Views
robert99
Specialist III
Specialist III

After further thought I am going to move on from select one monthYear and automatically populating say the previous 6 months (as it seems like in this situation it can't be done using AsofMonth). To getting the user to select the AsOfMonth (or AsOfMthYr that I will rename this) monthYears required

And converting the KPIs to a latest AsOfMonth selected as follows (for >30 days)

+

sum({<CanonType = {TransDate} //
,GLTransType = {ARDetail,ARAllocate} ,
Year = , YearFin = , Month = , WeekEnding =  , MonthYear =  , WeekEnding = , Rebates = , InterCompany =
,AsOfMthYr =  {">=$(=MAX(AsOfMthYr)) <=$(=MAX(AsOfMthYr))         " }
,ARInvDate = {">=$(=max(monthend(AsOfMthYr))-30)"}  
>}  
ARValue)

The table expression (see above) is then straight forward (example 60-90 days)

sum({<CanonType = {TransDate} //
,GLTransType = {ARDetail,ARAllocate}
>}if( ARInvDate > (mONTHEND(AsOfMonth) - 90)   and ARInvDate  < (MONTHEND(AsOfMonth)-60)  ,ARValue))

 The way I had done it before was far too confusing. It was easy and worked well for the end user but it required sometimes using MonthYear and somethings AsOfMonth throughout the pages


0 Likes
1,850 Views
varenich
Contributor II
Contributor II

As-Of tables work fine with 1000 records but with 150 000 records it hangs up computer to hard reboot Smiley LOL

Is there an alternative to As-Of tables?


0 Likes
1,721 Views