hic
Former Employee
Former Employee

There are a number of prefixes in QlikView, that help you load and transform data. One of them is the Crosstable transformation.

Whenever you have a crosstable of data, the Crosstable prefix can be used to transform the data and create the desired fields. A crosstable is basically a matrix where one of the fields is displayed vertically and another is displayed horizontally. In the input table below you have one column per month and one row per product.
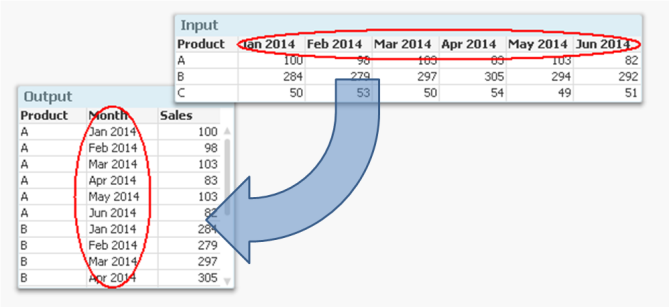
 

Crosstable transformation4.png


But if you want to analyze this data, it is much easier to have all numbers in one field and all months in another, i.e. in a three-column table. It is not very practical to have one column per month, since you want to use Month as dimension and Sum(Sales) as measure.


Enter the Crosstable prefix.


It converts the data to a table with one column for Month and another for Sales. Another way to express it is to say that it takes field names and converts these to field values. If you compare it to the Generic prefix, you will find that they in principle are each other’s inverses.


The syntax is


   Crosstable (Month, Sales) Load Product, [Jan 2014], [Feb 2014], [Mar 2014], … From … ;


There are however a couple of things worth noting:

  • Usually the input data has only one column as qualifier field; as internal key (Product in the above example). But you can have several. If so, all qualifying fields must be listed before the attribute fields, and the third parameter to the Crosstable prefix must be used to define the number of qualifying fields.
  • It is not possible to have a preceding Load or a prefix in front of the Crosstable keyword. Auto-concatenate will however work.
  • The numeric interpretation will not work for the attribute fields. This means that if you have months as column headers, these will not be automatically interpreted. The work-around is to use the crosstable prefix to create a temporary table, and to run a second pass through it to make the interpretations:


   tmpData:

   Crosstable (MonthText, Sales)

   Load Product, [Jan 2014], [Feb 2014], … From Data;


   Final:

   Load Product,

      Date(Date#(MonthText,'MMM YYYY'),'MMM YYYY') as Month,

      Sales

      Resident tmpData;

   Drop Table tmpData;


Finally, if your source is a crosstable and you also want to display the data as a crosstable, it might be tempting to load the data as it is, without any transformation.


I strongly recommend that you don’t. A crosstable transformation simplifies everything and you can still display your data as a crosstable using a standard pivot table.


HIC

72 Comments
MK_QSL
MVP
MVP

Thanks for sharing....

0 Likes
51,156 Views
Jason_Michaelides
Luminary Alumni
Luminary Alumni

Thanks Henric. I find Crosstable() one of the most useful functions in QlikView but it does have one drawback - it is very slow. It does seem to work multi-threaded, but each core is only very slightly utilized. Can you shed some light on how this function works at a CPU-level?

Thanks again,

Jason

0 Likes
51,156 Views
ThornOfCrowns
Specialist II
Specialist II

Useful and interesting as always, thanks!

0 Likes
51,156 Views
sudeepkm
Specialist III
Specialist III

Hi Henric,

Thanks a lot for the post.

I think here we have to be careful in writing count(Product) as once we create the cross table the Product is repeated. So it has to be count(Distinct Product) to get the number of unique products.

One more thing is how to handle a scenario where we expect more columns to be in coming. like

in your example suppose in the month of Aug 2014 the source will have one more column for Jul2014?

51,156 Views
hic
Former Employee
Former Employee

You are right that Count(distinct Product) is the correct way to count products here.

If you have two different numbers for each month, e.g. no of units and sales amount, then you need to load two tables from the same source:

Crosstable (Month, Sales)

   Load Product, [Sales Jan 2014] as [Jan 2014], [Sales Feb 2014] as [Feb 2014], … From … ;

Crosstable (Month, Units)

   Load Product, [Units Jan 2014] as [Jan 2014], [Units Feb 2014] as [Feb 2014], … From … ;

HIC

51,156 Views
sudeepkm
Specialist III
Specialist III

Hi Henric,

Thanks a lot for your response. I still have this question for you.

The Source file will change every month by one additional column presenting the Recent Month.

For example in the month of July 2014 the source file has Jan-2014 till Jun-2014 columns but in Aug-2014 the source file will change and will have one more column as Jul-2014.

I would like to take your advice how to handle this type of Source files in QlikView.

Is it like I may have to put an if else block which checks the current month and based on which it will have a cross table load script.

In that case I may end up in creating 12 different script blocks per every month. Thanks in advance.

51,156 Views
rwunderlich
Partner Ambassador/MVP

When you have increasing months, you can use

LOAD *

-Rob

40,224 Views
Jason_Michaelides
Luminary Alumni
Luminary Alumni

Sudeep,

Just use a LOAD * in your Crosstable() script. That will add months in automatically as they are added to the table. Be aware, of course, that if any other unwanted fields are added to the source table they will also be added to the Crosstable().

Jason

EDIT: Just seen Rob has answered the same already! Sorry

0 Likes
40,224 Views
sudeepkm
Specialist III
Specialist III

Thanks a lot. I got it.

0 Likes
40,224 Views
jimshakes
Contributor III
Contributor III

Crosstable is very useful but I've found that it's only useful with small amounts of data, when you scale the data up you start hitting performance issues and this turns out to be extremely slow.

Is there anything that can be done to help speed it up or is this just a known issue/Crosstable should only ever be used for smaller amounts of data?

Thanks

40,224 Views