hic
Former Employee
Former Employee

One of the most common problems to solve in data modeling is that of time. How to assign month name and other time attributes to a date. The solution is called a master calendar.

A master calendar table is a dimensional table that links to a date in the data, e.g. OrderDate.  The table usually does not exist in the database, but is nevertheless needed in the QlikView application for a proper analysis. In the master calendar table you can create all time and date fields that you think the user needs; e.g. Month, Year, Quarter, RollingMonth, FiscalMonth or flags like IsCurrentYear, etc.


A typical master calendar tables contains one record per date for the time period used in the QlikView app, perhaps a two-year period, i.e. 730 records. It is in other words a very small (short) table. Since it is small, you can allow yourself to have many fields in it – it will not affect performance in any significant way.


There are in principle three ways you can generate the records (with an infinite number of variations in the details):

  • Load from the fact table, e.g.
    Load distinct Date, Month(Date) as Month resident TransactionTable ;
  • Generate all dates within a range, using autogenerate, e.g.
    Load Date, Month(Date) as Month … ;
    Load Date($(vStart) + RecNo()) as Date autogenerate $(vEnd) - $(vStart) ;
  • Generate all dates within a range, using a while loop, e.g.
    Load Date, Month(Date) as Month … ;
    Load Date(MinDate+iterno()) as Date While iterno() <= MaxDate - MinDate ;
    Load Min(Date)-1 as MinDate, Max(Date) as MaxDate resident TransactionTable


In the first case you use the table to which you are going to link the master calendar. This way you will get exactly those values that really exist in the database. Meaning that you will also miss some dates – e.g. Saturdays and Sundays most likely - since they often do not exist in the database.


In the second case, you generate a range of dates. This is a good solution, but it means that you will need to define the range beforehand. There are several ways to do this, e.g. find largest and smallest value in the data; or hard-code the days for the relevant year.


In the third solution, you generate all dates between the first and last date of your transaction table. This is my preferred solution. Optionally you can use YearStart(Min(Date)) and YearEnd(Max(Date)) to define the range.


Data Model.png


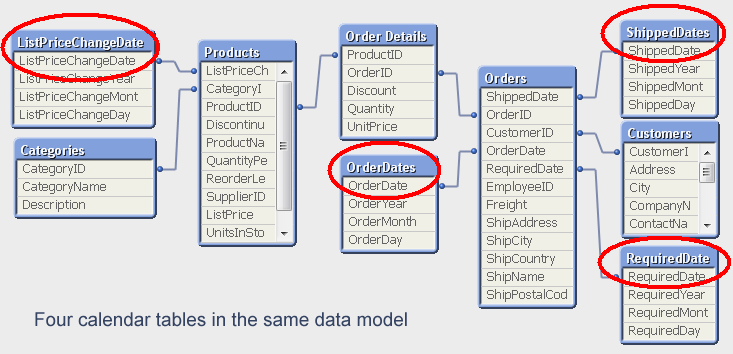
The word "Master" for the calendar table is really misleading. There is no reason to have only one calendar table. If you have several dates, you should in my opinion use several calendar tables in the same data model. The alternative - to have the same calendar for all dates - is possible using a link table but complicates the data model and limits how the user can make selections. For example, the user will not be able to select OrderMonth=’Sep’ and at the same time ShipperMonth=’Nov’.


Bottom line: Use a calendar table whenever you have a date in your database. Use several if you have several dates.


HIC

34 Comments
swuehl
MVP
MVP

Henric,

another nice contribution to a very helpful series of blogs.

I think there is one open question that I came across very often in the forum:

What is your suggested approach if one needs to draw several measures based on the different date fields against a common time line? Like I want to compare #  of shipments and orders for the days in October 2012?

Regards,

Stefan

14,440 Views
hic
Former Employee
Former Employee

Stefan

I once faced this problem when I worked in Germany. The customer was an insurance company and the core of the data model was very simple – two tables: paid primes and paid damage compensations. With a date in each table…

The simple solution would have been to link the two tables on dates, but then I would not have been able to use the natural link: Insurance policy ID.

The solution I made was instead to first add one calendar table to each date and in addition also a logical island – an unconnected Master Calendar table. Then I made a bar chart where I used the Month from the master calendar as dimension and two expressions:
     Sum(if(Month=PrimeMonth, PrimeAmount))
     Sum(if(Month=CompensationMonth, CompensationAmount))

This way I could link the Month from the master table to the two different dates and compare received money against paid money. If this is the best solution, I do not know. But still today, I haven’t found any better. I am open to suggestions...

HIC

14,440 Views
Or
MVP
MVP

I've used the same approach with some success, Henric - and like you, I've yet to come up with a better option. In my case, I've used it to compare support load (opened cases vs. closed cases), for example - but it gets pretty complicated once you leave the cozy confines of monthly analysis and try to run a daily or even hourly one. This is one of the rare cases where I wish QlikView had "context" joins that would only activate when we wanted them to.

0 Likes
14,440 Views
Anonymous
Not applicable

Most often, I use calendar based on a pre-define date range,
but the definition as a rule is "dynamic".  For example, I want to load transaction data
starting on January 1 of the year three years back, and ending December 31 next
year.  That means, I need two variables
defined on the front end (in input box, or variables overview), e.g. YearsBack
(in my example it will be 3) and YearsForward (1).  In the script, before building the calendar,
define start and end dates:

LET vStart=yearstart(AddYears(today(),- YearsBack));

LET vEnd=yearend(AddYears(today(),+YearsForward));

These variables are used not only to create the calendar,
but also as the conditions for loading the data from the DB tables.

Regards,

Michael

0 Likes
14,440 Views
Not applicable

Hi All,

I have the data in design level like 2001-02,2002-03......2012-13,2013-14.

The requirement is like i have put next and previou buttons before and after the list box.

and i have to disable the next option for last year is like 2013-14 and disable the previous button like for 2001-02.

Thanks in advance.

14,440 Views
Not applicable

Very helpful information. I implemented it to my QV module and it works perfect! However, I am currently facing one big problem. If I use date island and use the monthname of the date island as my dimension, then how to aggregate my data over the unlinked dimension?

Thank you so much!

0 Likes
14,440 Views
Not applicable

Good morning Henric,

I am faced with this same problem, i.e. insurance data is your above solution still the best way?

Regards

Herbert

0 Likes
11,974 Views
hic
Former Employee
Former Employee

No. Today I would instead use a Canonical date. The only drawback with the canonical date is that the DateBridge table can become very large. If this turns out to be a problem, you should instead go for the solution with a logical island.

HIC

0 Likes
11,974 Views
Not applicable

Hi Henric,

Can you please assist on how to apply a canonical calendar to this data set:

Canonical Calendar.jpg

Thank you

0 Likes
11,974 Views
hic
Former Employee
Former Employee

First, the DateBridge table can be created using:

Load [Policy Number], [Trans Date] as Date, 'Premium' as Type Resident Premiums;

Load [Policy Number], [CTrans Date] as Date, 'Claim' as Type Resident Claims;

Then you create a master calendar on the "Date" field, which is your canonical date.

HIC

0 Likes
11,974 Views