Unlock a world of possibilities! Login now and discover the exclusive benefits awaiting you.
- Subscribe to RSS Feed
- Mark as New
- Mark as Read
- Bookmark
- Subscribe
- Printer Friendly Page
- Report Inappropriate Content
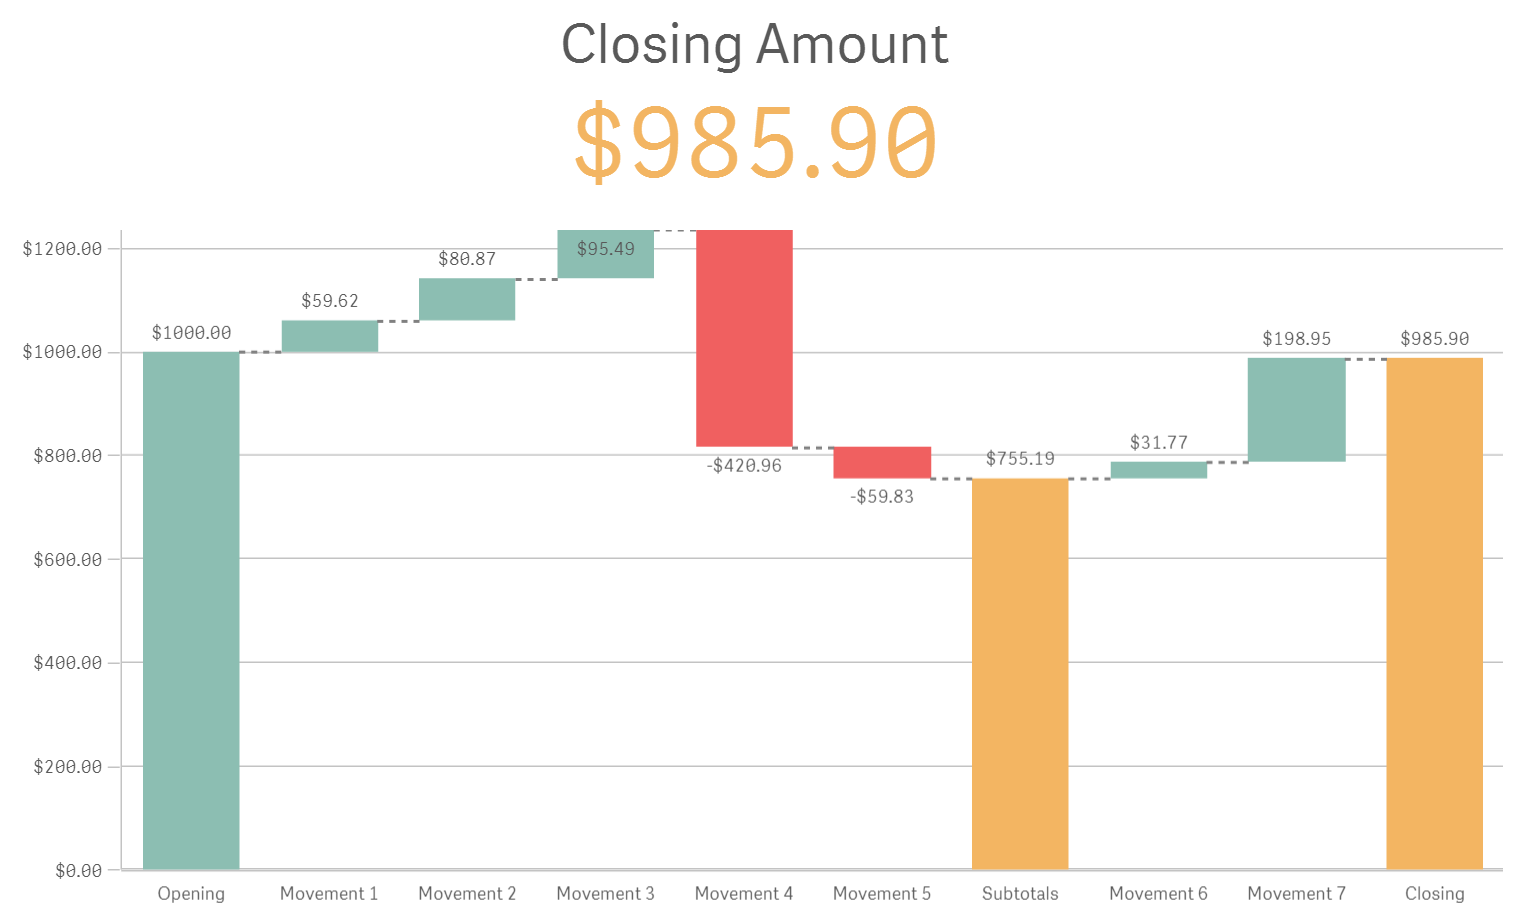
One of our new additions to the charts library is the Waterfall chart. It’s useful to visualize how an initial value evolves (increment or decrements) over time or in distinct stages. It’s widely used across companies and finance analysis seems to be a good fit for the waterfall chart. We commonly see this type of chart for Income or Cash flow statements.
How it works?
Qlik Sense waterfall chart is a simple non-dimensional chart, it’s composed by expressions only. Each measure can be configured to “Add”, “Subtract”, or “Subtotal”. Meaning we have total control over the graphical representation of the values, we could tell a positive number to subtract its value from previous column and viceversa.
The Income Statement example
The CFO of the company Fitness Equipment Limited (from Wikipedia) wants to visualize and analyze its company income statement by year.
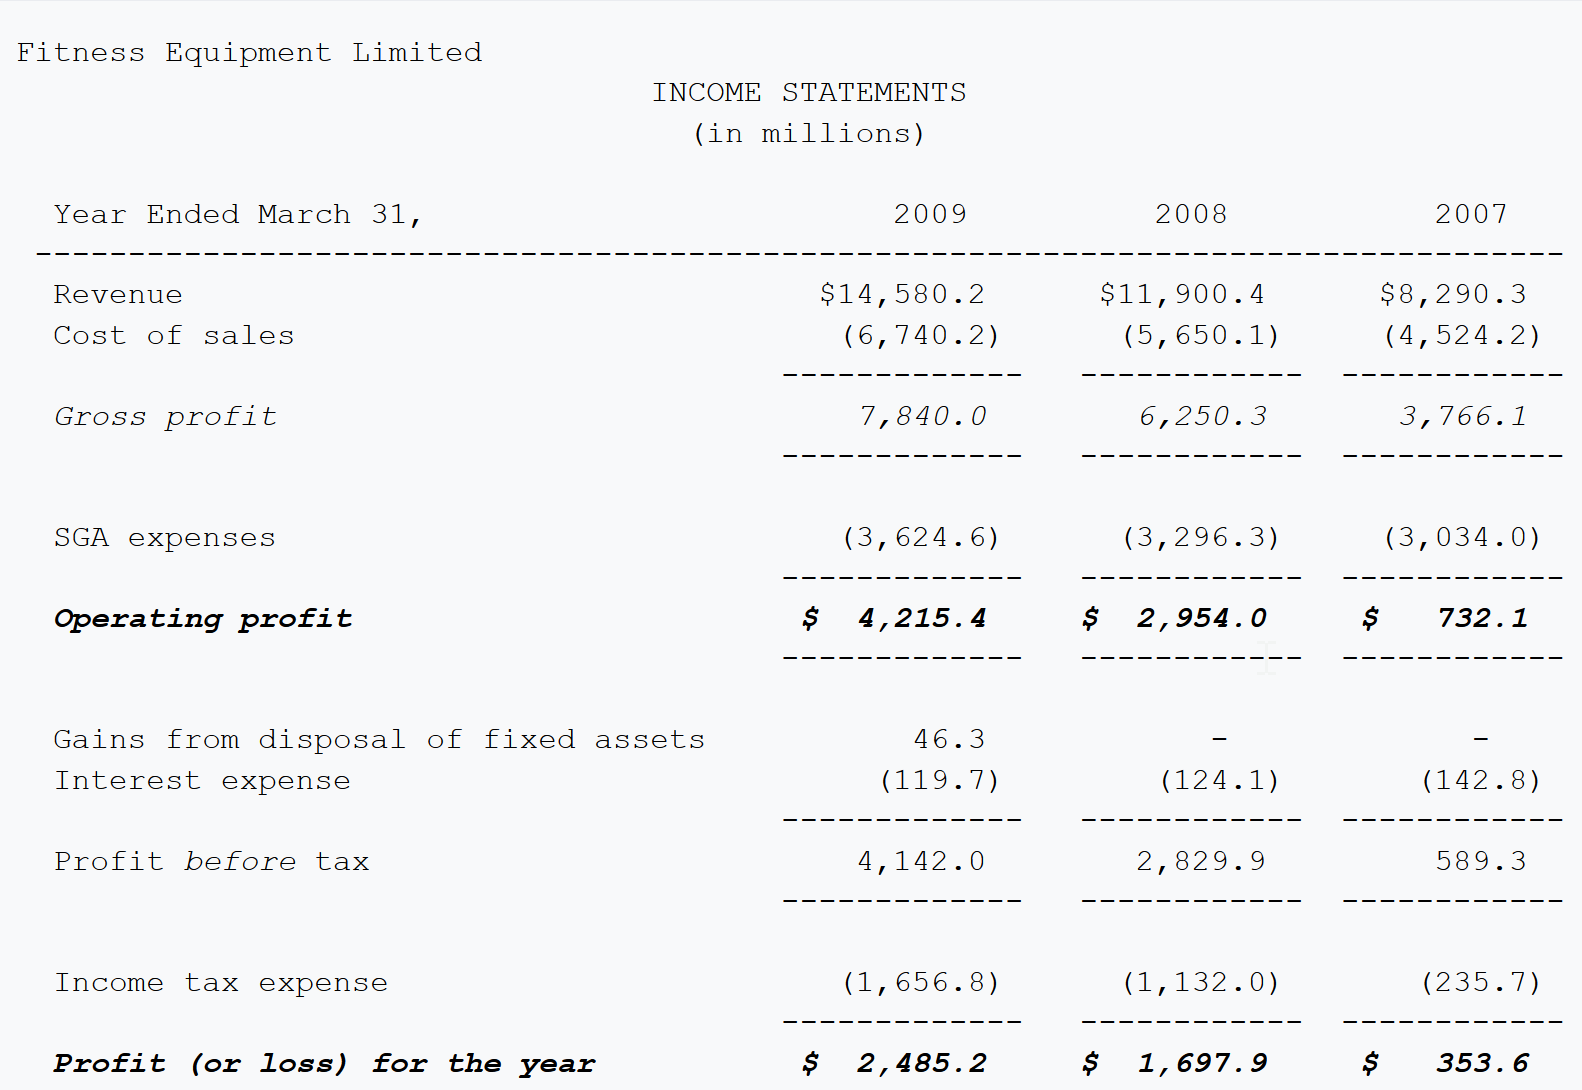
After getting the data into Qlik Sense (one table with three columns, Concept, Year, and Amount) it's time to represent the Income Statements table above with a Waterfall chart. Remember, the goal is to show the profit (or loss) for the year amount, but more importantly how was the flow to get to that amount.
Creating the chart
- In edit mode, drag and drop the new Waterfall chart into the Qlik Sense app
- Add the first measure, it will typically be the starting amount or opening value. Revenue will make it in our example.
Sum({<Concept={'Revenue'}>}Amount) - Add as many measures as you need to complete the individual contributing amounts. In our example:
- Cost of Sales
- SGA expenses
- Gains from disposal of FA
- Interest expense
- Income tax expense
Subtotals
For those balance measures and those amounts that denote subtotals such as Gross Profit or Operating profit we don't need to create an expression, we just need to check the subtotal checkbox in the preceding measure.
For example, to calculate Gross Profit (Revenue - Cost of Sales) check "Subtotals" check box in Cost of Sales measure and set the "Subtotal label" to Gross Profit. Perform the same operation for all of the balance points in the chart.
Spicing it up
Waterfall chart comes with the usual customization panels as seen in any other Qlik Sense chart, but this time we have a dedicated Color section that includes a color picker for each one of the bar types that inhabit your chart.
The final waterfall chart looks like the picture below. It includes a year list box so now the CFO and any user will be able to quickly visualize different years of Income Statements to analyze how each piece contributes to the total profit.
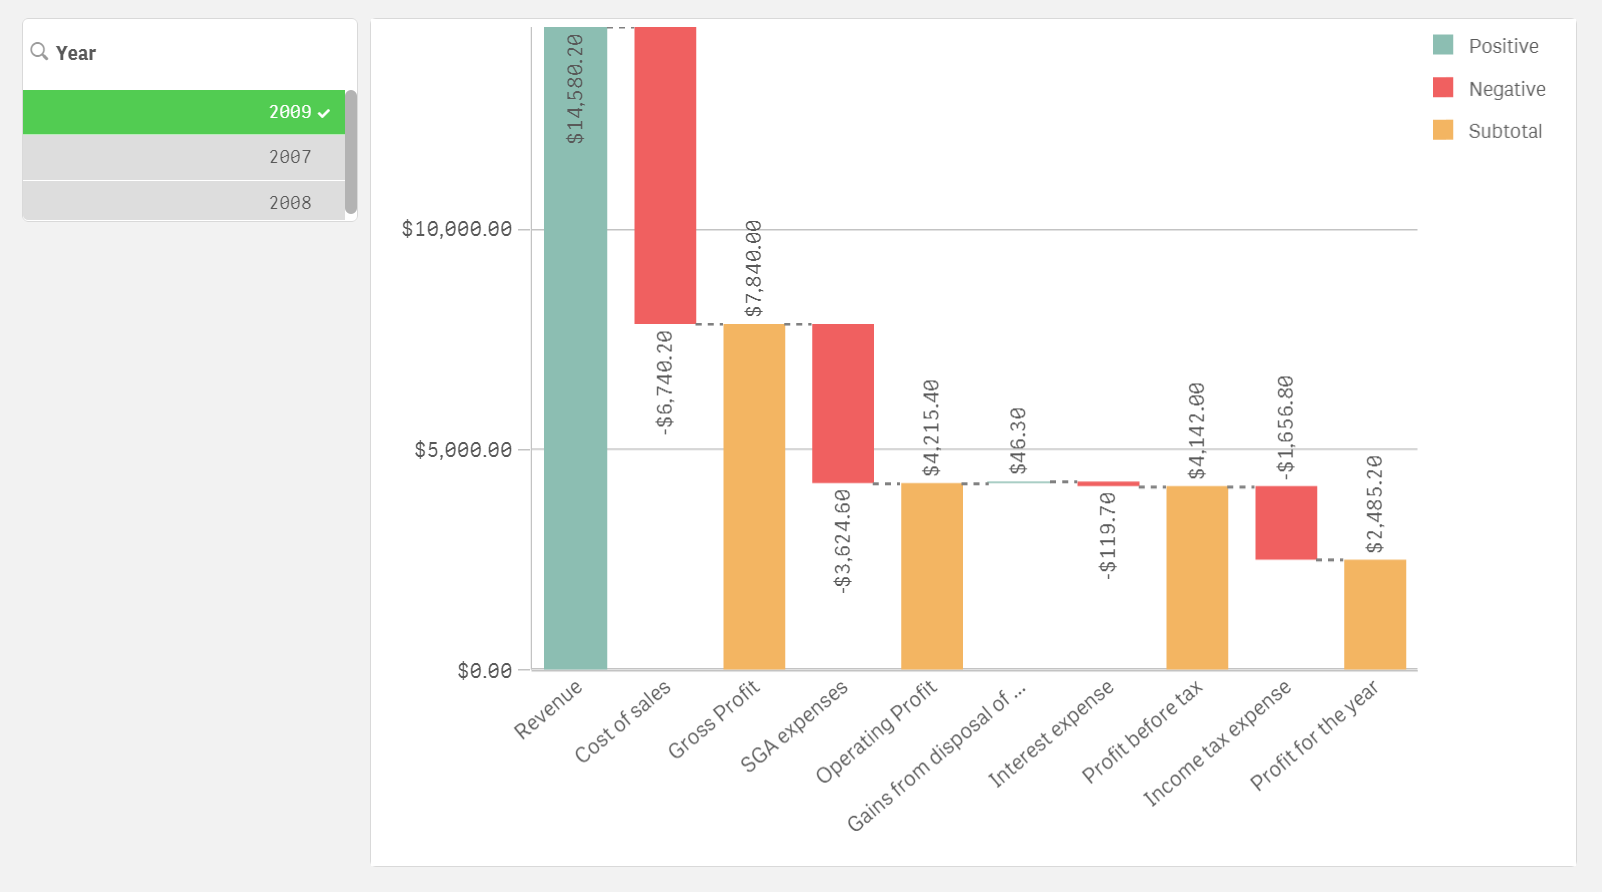
This is just an example of what a Waterfall chart can do for your business but I'm sure there are many more use cases for it, please share your experience with Waterfall chart in the comment section below.
Enjoy it!
PS: Find attached the Qlik Sense with the examples shown in the blog post
You must be a registered user to add a comment. If you've already registered, sign in. Otherwise, register and sign in.