hic
Former Employee
Former Employee

The total in a chart is not the sum of the individual rows of the chart.

Instead, the total and the subtotals are calculated using the expression – but on a larger subset of the data than for the individual row.

Usually, the two methods result in the same numbers, but sometimes there is a huge difference. One example of this is if you use a non-linear function, e.g. Count(distinct …) as expression. The example below clearly shows this.

CountDistinct.png

The source data to the left assigns a country to each state, and if you count the number of countries per state using a Count(distinct Country), you will get the chart to the right: Each state belongs to one country only, and the total number of countries is 2, also if the chart has four rows.

A second example is if you have a many-to-many relationship in the data. In the example below, you have three products, each with a sales amount. But since each product can belong to several product groups, the sales amounts per product group will not add up: The total will be smaller than the sum of the individual rows, since there is an overlap between the product groups. The summation will be made in the fact table.

ManyToMany.png

Another way to describe it would be to say that a specific dollar belongs to both product groups, and would be counted twice if you just summed the rows.

In both cases, QlikView will show the correct number, given the data. To sum the rows would be incorrect.

So, how does this affect you as an application developer?

Normally not very much. But it is good to be aware of it, and I would suggest the following:

  • When you write your expression, you should have the total line in mind. Usually, the expression will automatically be right also for the individual rows.
  • Always use an aggregation function. This will ensure that QlikView is able to calculate the total correctly.
  • If you want an average on the total line, you should most likely divide your expression with Count(distinct <Dim>). Then it will work both for the individual rows (where the count is 1) and the total lines. Example

          Sum( Amount ) / Count( distinct Customer )

  • For cases where you want to show something completely different in the total line, you should consider the Dimensionality() function, that returns 0, 1, 2, … depending on whether the evaluation takes place in a total, subtotal or row. Example:

          If( Dimensionality() = 0, <Total line expression>, <Individual line expression> )

But If I want to show the sum of the individual rows? I don’t want the expression to be calculated over a larger data set. What do I do then?

There are two ways to do this. First, you can use an Aggr() function as expression:

          Sum( Aggr( <Original expression> , <Dimension> ) )

This will work in all objects. Further, if you have a straight table, you have a setting on the Expressions tab where you can specify the Total mode.
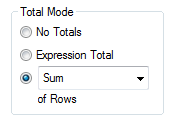
Total Mode.png

Setting this to Sum of Rows will change the chart behavior to show exactly this: The sum of the rows.

HIC

32 Comments
richard_pearce6
Luminary Alumni
Luminary Alumni

Hi Henric,

As always a great post.

I have a question; My understanding is aggr() has a larger calculation overhead that a simple sum().

Would you advise always use aggr() or, as I do, use aggr when required?

For me this may be using averages on the charts line and don't want to show a true average on the whole data set in the total.

I guess this depends on your data and your requirements. For me this is something to always have in mind when developing although 99% of the time a basic sum() type expression will give me the correct results.

Richard

QlikCentral.com

0 Likes
6,466 Views
robert99
Specialist III
Specialist III

Good to be aware of this. As I wasn't when initially using QlikView.

An example I encountered was for  a service business.

I was required to show the distinct job count (distinct Call_Num) done over each month and year. The months did not add to the year (as a small number of jobs were started one month/year and finished the next). I was sort of Ok with this as the reason was clear and the difference was small. But a new manager was initially convinced my report was inaccurate (as I was at first).

if I was doing it again I would only include jobs finished for a year or month. As this report column just does not seem right (when the total is not the sum of the individual rows) even though the difference was small.

0 Likes
6,466 Views
hic
Former Employee
Former Employee

Richard

Aggr() does indeed have a larger calculation overhead, since it implies a two-level, nested aggregation, whereas a simple Sum() is a single, faster aggregation. So my advice would be not to use Aggr(), unless absolutely necessary.

HIC

6,466 Views
richard_pearce6
Luminary Alumni
Luminary Alumni

Thanks Henric, this is what I thought. Your post reads the opposite in your suggestions so wanted to clarify your thoughts.

Cheers

Richard

6,466 Views
Anonymous
Not applicable

Ohh !

Greaty Suggestion !

0 Likes
6,466 Views
kalyandg
Partner - Creator III

hi HIC,

please suggest me for the below one

am having on issue, i have two date columns Transaction date and Duedate,

my report is calculated using Start and End date,

the following expression works, if date is present as dimension,

sum(amount)*(0.06)/360*(30-day(duedate)+1)

+

sum(amount)*(0.06)/12*((floor(End-DueDate)/30)-1)

+

sum(amount)*(0.06)/360*(day(End)-1)

if date is removed from dimension, the above calculation not works,

30-day(duedate)+1 is calculated in script, so no problem when i use field,

day(End)-1 is calculated in script, so no problem

(floor((End-Duedate))/30)-1 is not calculated in script, because, End is date, and Duedate is date but from different table.

i need the report as summary level not as a detailed...

could you please suggest some idea.

Thanks,

Kalyan.D

0 Likes
6,466 Views
hic
Former Employee
Former Employee

Most likely, a specific row in the fact table (where "amount" is) can only have one "DueDate" and one "End" associated with it. If so, you should move your calculation into the Sum function:

   0.06* sum(amount *

         (

         1/360*(30-Day(DueDate)+1) +

         1/12*((Floor(End-DueDate)/30)-1) +

         1/360*(Day(End)-1)

         )

   )

HIC

0 Likes
5,341 Views
kalyandg
Partner - Creator III

HIC,

Thanks for your reply.

End date is taken from Logical island(Master Calendar), its not associated with fact table.

Please help.

Best Regards,

Kalyan.D

0 Likes
5,341 Views
hic
Former Employee
Former Employee

Then the formula I suggested should work - as soon as you have a single End date selected.

HIC

0 Likes
5,341 Views
kalyandg
Partner - Creator III

HIC,

Thank you very much,

Its working fine.

Once again I thank you.

Best Regards,

Kalyan.D

0 Likes
5,341 Views