hic
Former Employee
Former Employee

Hierarchies are very common in all database and business intelligence solutions. Usually they are balanced and with a fix number of levels, and then they do not pose any problems. Just load the data, add a drill-down group, and you’re done.


Adjacent Notes source 2.png

But there is one type of hierarchy that is somewhat tricky to get right – an unbalanced, n-level hierarchy. Typical for this type of hierarchy is that the levels are not named, and you really don’t know on which level you need to search for a specific node.


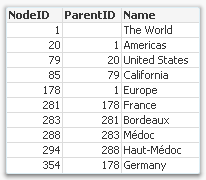
Usually such a hierarchy is stored in an Adjacent Nodes table, i.e. a table that has one record per node and each node has a reference to its parent.


Such a table can be loaded into QlikView directly using the Hierarchy prefix. This prefix will transform the Adjacent Nodes table into an Expanded Nodes table that has additional fields that you can use in your app.


Data model single table - BP.png


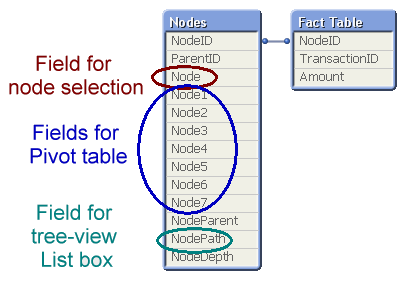
With the fields in this table, you can easily create a pivot table and a tree-view list box. Below you can see some wine districts displayed in both these object types:


Tables - BP.png


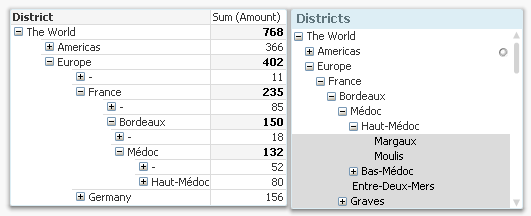
One challenge with hierarchies is that you can refer to a node in two different ways: Either to the node including the entire sub-tree, or to the node only, excluding all sub-nodes. In the example with the wine districts, it would mean any wine from Bordeaux, and unspecified Bordeaux, respectively. In the pivot table above, the difference is obvious: Any wine from Bordeaux sums up to 150 units, and the unspecified Bordeaux sums up to 18 units.


A user usually wants to make selections referring to the entire sub-tree, but the above solution does not have any field for this. To create such a field, you need the second hierarchy-resolving prefix – the HierarchyBelongsTo.


This prefix will also transform the hierarchy table. The result will be a table containing one record per descendant-ancestor pair. In other words, the ancestor (tree ID) will link to all its descendants (node ID), and can thus be used to make selections of entire sub-trees. (The “TreeBridge” table in the picture below.)


But it doesn’t stop here… The above solution creates one field in which tree searches can be made, but in order to create a drill-down for trees, you need an additional table – an expanded nodes table for the trees. This can be created with a second Hierarchy statement, but now one that links to the tree ID instead of the node ID. (The “Trees” table in the picture below.)


Data model full - BP.png


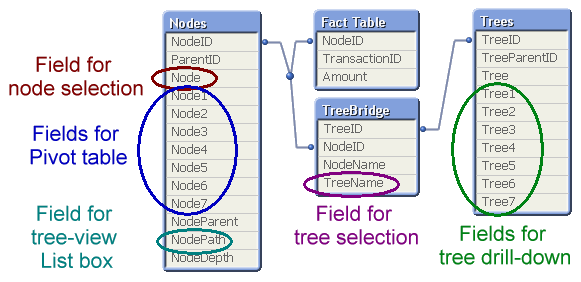
The data model with the three hierarchy tables is the one I recommend: It generates all fields you need.


A more elaborate explanation with script examples can be found in the technical brief about Hierarchies.


HIC


Further reading related to this topic:

Authorization using a Hierarchy

Bill of Materials

44 Comments
Not applicable

Hi Henric,

Thanks for sharing the code link. Would be able to share how you can build the Districts pivot table with tree view which expands and collapses as shown by you at the top, that would be of great help to better understand the article.

Appreciate all your help.

Happy Thanks Giving!

Thanks,

DD

0 Likes
6,323 Views
hic
Former Employee
Former Employee

The pivot table is easy to make:

  • Create a pivot table with Node1..Node7 as dimensions.
  • Make the dimension columns narrower.
  • On Properties - Style, check the "Indent Mode"
  • Also check the "Use only first dimension label"
  • Uncheck "Vertical Dimension Cell Borders"
  • On Properties - Presentation, check the "Subtotals on Top"

Done!

HIC

0 Likes
6,323 Views
Not applicable

Thanks Henric, will try to work with the suggested solution. Hope it works as planned.

Thanks,

DD

0 Likes
6,264 Views
Not applicable

Can you please share the qvw file that shows your sample example mentioned above, to get better idea on the hierarchy concept.

Thanks,

DD

0 Likes
6,264 Views
Not applicable

Hi Henric - Excellent technical brief!!

I'm dealing with a manufacturing bill of materials that is unbalanced, ragged and "multi-parented." That is, a sub-component can appear as the child in multiple, different parent components … and at different levels in the tree as well.

I believe it is the multi-parented aspect that causes the Hierarchy load and HierarchyBelongsTo to not work. (Actually, I have only proved HierarchyBelongsTo to not work, but I have not confirmed Hierarchy does work.) By "not work" I mean there are cases where a child component is not present in all branches.

Would you expect this to happen?

6,264 Views
hic
Former Employee
Former Employee

Bill

We have had bugs in this area - bugs that made the Hierarchy statement not always respect multiple parents. This has been fixed in SR5. If you run the following script:

Hierarchy (Node, Parent, NodeName) Load Node, Node as NodeName, Parent inline

[Node, Parent

A,

B,

B,A

B,A

C,A

C,B];

you should get 8 records in your table, but in some older versions you only get 6.

RowCount.png

Further, a BoM is difficult to model. See Roland Vecera's question above and my answer to it.

HIC

0 Likes
6,264 Views
Not applicable

Henric, working on an interesting hierarchy question with regards to HR reporting.  I have snapshot data throughout the life of a company at yearly, quarterly, monthly and daily levels of granularity.  We plan to build an app combining the data at the month level.  The data reflects both active and terminated employees and we want to look at headcount over time starting off in relation to each manager's organization.  The issue I can see is that managers can change and employees can move (slowly changing dimensions?).  We have a flag to designate the granularity and date of snapshot. 

How would you recommend handling this type of changing structure so we can capture the information correctly? 

0 Likes
6,264 Views
hic
Former Employee
Former Employee

I am not sure that this is an unbalanced hierarchy. I think you can achieve quite a lot using a standard model with a master calendar (daily levels of granularity) and slowly changing dimensions. The problem is however how you count the number of employees - Min, Max or Average during a period?

If it is Average, then you should probably use Year/Quarter/Month as dimension and an expression along the following idea:

  Avg(Aggr(Count(distinct EmpID),Date))

HIC

0 Likes
6,264 Views
Not applicable

Hello Henric,

Do you know of any software to administrate such hierarchy (NodeId, ParentId, Name) and associate units (business units) to any level? Any recommendation.

For the moment, I developed my own Excel macro but it won't be viable in the long terms.

Thanks,

0 Likes
6,246 Views
sudeepkm
Specialist III
Specialist III

Again Nice topic. informative. Thanks a lot.

0 Likes
6,246 Views