Unlock a world of possibilities! Login now and discover the exclusive benefits awaiting you.
- Subscribe to RSS Feed
- Mark as New
- Mark as Read
- Bookmark
- Subscribe
- Printer Friendly Page
- Report Inappropriate Content
On the discussion forum, I often see people posting questions around expressions that don’t work. When looking at the descriptions, I usually find that the reason is that the expressions lack aggregation functions. So, here is a suggestion...
Always use an aggregation function in your expression.
The reason is that a field reference in an expression always means an array of values. Which in turn means that you must enclose it in an aggregation function to make it collapse into one value:
OrderDate An array of values
Max(OrderDate) A single value
If you don't use an aggregation function, QlikView will use the Only() function. Hence, if the field reference returns several values, QlikView will interpret it as NULL, and the expression will not be evaluated the way you want it to.
Example 1: Use of the If() function:
If() functions are often used for conditional aggregations:
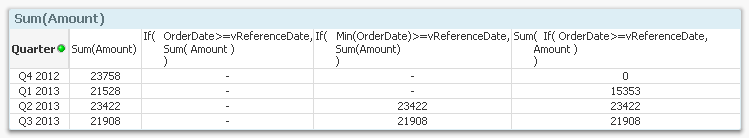
If( OrderDate >= vReferenceDate, Sum(Amount) )
At first glance, this expression may look correct: For dates after a reference date, the field Amount should be summed. Right?
Wrong.
OrderDate is a naked field reference: It does not have an aggregation function. Hence, it is an array, possibly with several values, and if so, evaluates to NULL. If you are lucky, there is only one date per dimensional value in your chart, and the expression will calculate fine. However, QlikView will probably not be able to calculate the expression for the subtotals in the chart, since there for those exists several dates.
A correct expression that always works should use a Min() or some other aggregation function in the first parameter of the If() function:
If( Min(OrderDate) >= vReferenceDate, Sum(Amount) )
Or, alternatively, the If() function should be put inside the Sum() function:
Sum( If(OrderDate >= vReferenceDate, Amount) )
In the first of the two expressions, the If() function will be evaluated once per dimensional value; in the second once per row in the raw data. The results are slightly different, but both return an answer, as opposed to the original expression. The picture below shows the difference between the expressions, using 2013-02-01 as reference date.
Example 2: Sort by expression:
The expression used to sort the dimensional values in a chart is also an aggregation. Often you don’t think about this since you choose an expression that returns just one value per dimensional value, and then a naked field reference works fine.
But sometimes this still doesn't work…
For example, say that you want to show support cases in a CRM system. You create a chart with the support case as dimension and some measure as expression. Of course you want to sort the support cases chronologically, so you use "Sort by Expression" and as expression you choose
[Opening Date]
This will work in most cases. However, some CRM systems allow you to re-open a support case, hence assigning two opening dates to one single support case. For these cases, the above expression will not work.
Instead, you should always ask yourself which function to use, should there be two values. The answer is usually Sum(), Avg(), Min() or Max(). In the above case, you should use
Min([Opening Date]) , or
Max([Opening Date])
depending on whether you want to use the first or last date.
Bottom line: Use aggregation functions, not just in your chart measures, but also in sort expressions, labels, show conditions, calculation conditions, text boxes, sheet names and searches.
Further reading related to this topic:
You must be a registered user to add a comment. If you've already registered, sign in. Otherwise, register and sign in.