Unlock a world of possibilities! Login now and discover the exclusive benefits awaiting you.
- Subscribe to RSS Feed
- Mark as New
- Mark as Read
- Bookmark
- Subscribe
- Printer Friendly Page
- Report Inappropriate Content
When developing a Qlik Sense app, there will come a time where you are going to want to define your own colors for certain values in a visualization. Did you know that Qlik Sense offers many ways to achieve your desired outcome? In this blog, I will talk through the different color functions, and show an example for each color function.
RGB()
RGB() is used in expressions to set or evaluate the color properties of a chart object, where the color is defined by a red component r, a green component g, and a blue component b with values between 0 and 255.
Syntax: RGB(r, g, b)
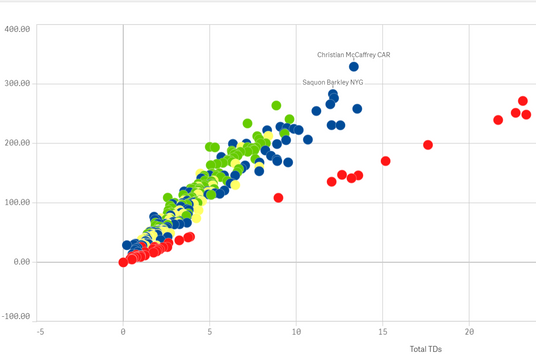
For this example, I am going to use fantasy football data. Let’s say I have a scatter plot and I want to color the values on the scatter plot a specific color based on player position. I can create an expression to target each position:
First thing that I need to do is open the chart properties and navigate to the Colors and Legend section and select by expression as my custom color property.
My expression:
Result:
Now let’s say that I want to soften my colors by adding some opacity to them. For that, we’ll use ARGB().
ARGB()
ARGB() is used in expressions to set or evaluate the color properties of a chart object, where the color is defined by a red component r, a green component g, and a blue component b, with an alpha factor (opacity) of alpha.
The first value is the opacity. The lower the number, the more the color will look faded.
Syntax: ARGB(alpha, r, g, b)
My expression:
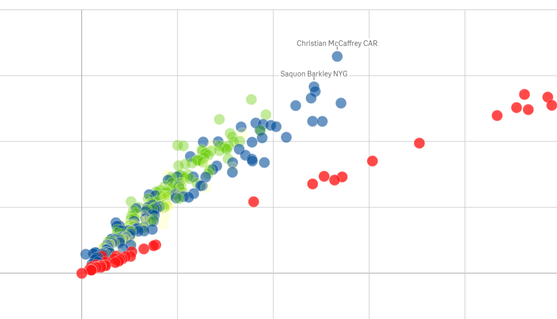
Result:
Red has a high alpha factor, which means it maintains more of the red color. Conversely, the yellow has a very low alpha number and renders as the most faded color.
Another way to color your values is the HSL() function.
HSL()
HSL() is used in expressions to set or evaluate the color properties of a chart object, where the color is defined by values of hue, saturation, and luminosity between 0 and 1.
Syntax: HSL (hue, saturation, luminosity)
This one is tougher to understand and you will need to perform some calculations in order to arrive at the correct HSL values. For example: The color blue that we used in the RGB function is RGB(0,76,153) after using an online RGB to HSL converter, we find that the new value for HSL is HSL(210 degrees, 100%, 30%). To make this a valid value for Qlik Sense we need to do some conversion. First we take the 210 degrees and divide that by 360 to get 0.583. We then convert the percentages to decimals. Our final value for the HSL for blue is HSL(0.583, 1, 0.30).
My expression:
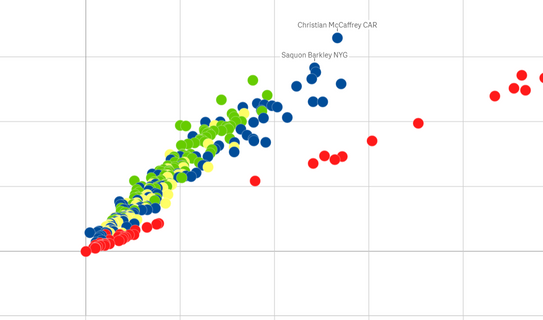
Result:
Color Function
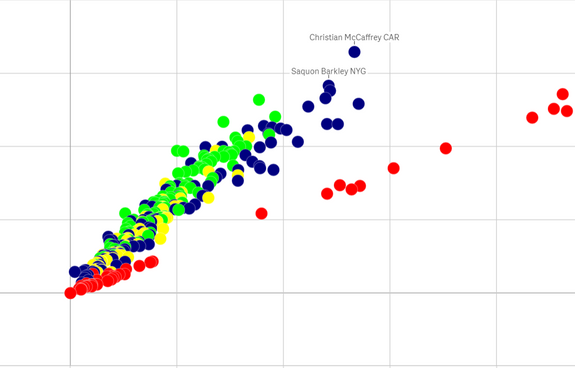
We can also use the many color functions defined in Qlik Sense. There are 16 defined colors: black(), darkgray(), lightgray(), white(), blue(), lightblue(), green(), lightgreen(), cyan(), lightcyan(), red(), lightred(), magenta(), lightmagenta(), brown(), yellow(). One thing to be aware of when using the predefined color functions is that you will lose the ability to match exactly to the color that you are envisioning.
My expression:
Result:
As you can see, there are many ways to achieve your desired color palette. Becoming familiar with these powerful functions can help to take you Qlik development skills to the next level. Happy Qlikking!
You must be a registered user to add a comment. If you've already registered, sign in. Otherwise, register and sign in.


