Unlock a world of possibilities! Login now and discover the exclusive benefits awaiting you.
- Subscribe to RSS Feed
- Mark as New
- Mark as Read
- Bookmark
- Subscribe
- Printer Friendly Page
- Report Inappropriate Content
Hey guys, I was recently at a user group meeting and the topic of IntervalMatch() came up with regards to when and where it was best used. I liked the topic and subject matter that was covered, so I decided to create a quick video showing you how I used it when rating or grading some video game consoles. Note that IntervalMatch() can be used in many situations, however there may be other approaches to achieve similar results. View the Qlik Help topic here.
IntervalMatch()
IntervalMatch is a data load script prefix that creates and links a table used for matching discrete numeric values to one or more numeric intervals where there may not be any specific link or key available between the tables. This is used in situations that utilize interval scales of data such as population, date ranges, temperature, number of units, scoring etc. to name a few.
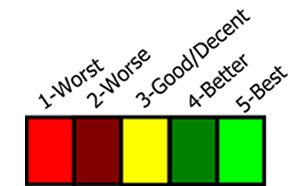
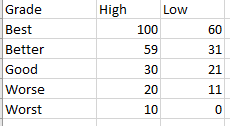
Let’s imagine I have a number of video game consoles that vary in condition. I want to assign them a rating from good to worst based on a numeric scale related to overall condition and function. I have a grading table that contains the numeric ranges for the grade as follows. Note the Grade field description and the High and Low field range values.
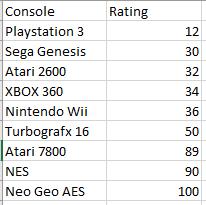
I also have a table that contains my consoles names and their individual rating numeric value.
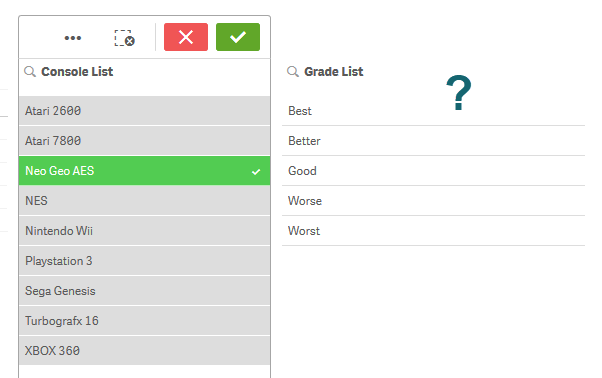
Since these two tables don’t have a common link between them, when the data is loaded and I select a value from either the console or the grade lists, I cannot see any of the relationships.
I can easily solve this using the IntervalMatch prefix which will look at the data already loaded from the grade table with the numeric intervals and match it to the Rating field in the consoles tables. IntervalMatch must come after the initial data is loaded and before the load statement as shown. (Please note that your interval field order is important, starting with the field containing the lowest interval value first.)
[Grade Ranges]:
LOAD
[Grade],
[High],
[Low]
FROM [lib://AttachedFiles/console_grades.xlsx]
(ooxml, embedded labels, table is [Grade Ranges]);


[Console Rating]:
LOAD
[Console],
[Rating]
FROM [lib://AttachedFiles/console_grades.xlsx]
(ooxml, embedded labels, table is [Console Rating]);


[interval match table]:
IntervalMatch(Rating)
Load
[Low],
[High]
Resident [Grade Ranges]
;
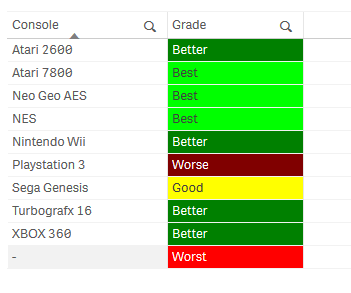
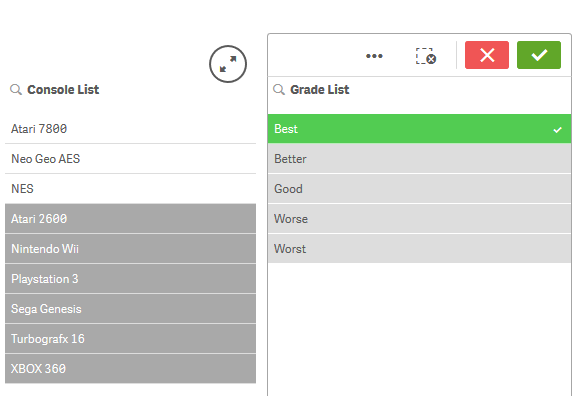
Upon loading the data – you can now see that the tables are now linked with this new interval table. Technically a synthetic key is created but in this situation I am told it is nothing to be concerned about. Now you can clearly see the grade of my consoles by either selecting the Grade or the Console list values or within the table visualization.
As always there usually is more than one solution to these types of problems, and perhaps some may be more optimal than others. I’d love to hear from you, so if you have another approach please share it with us.
Regards,
Mike Tarallo
Qlik
@mtarallo - Twitter
Can't see the video? YouTube blocked by your region or organization? Download the attached .mp4 to view on your computer or mobile device.
You must be a registered user to add a comment. If you've already registered, sign in. Otherwise, register and sign in.